


Following several weeks of local restrictions impacting more areas, this week saw the introduction of restrictions across the UK, including a 10pm curfew on our hospitality industry. The hope is that this will help slow and supress transmissions, including cluster events/super-spreaders.
As data emerges on new case numbers over the next week or two, we will be able to see if these restrictions slow the spread of COVID-19. If not, tighter national restrictions may need to be implemented.

Meanwhile, many local authorities in England and Wales continue to have localised additional restrictions in place. The option remains to extend the areas covered by these restrictions, rather than strengthening the overall national restrictions. In this blog we look at whether the restrictions have led to cases falling in these areas, or if community transmission remains a major concern. We also consider whether there are additional areas that might need tighter local restrictions introduced.
The overall picture on case numbers
The chart below shows the latest case numbers published by the UK government (as at late evening on 24th September). The bars show the daily numbers of new COVID-19 cases across the UK, with the line showing the running seven-day average, smoothing through dips in new case numbers which tend to happen for example at weekends.
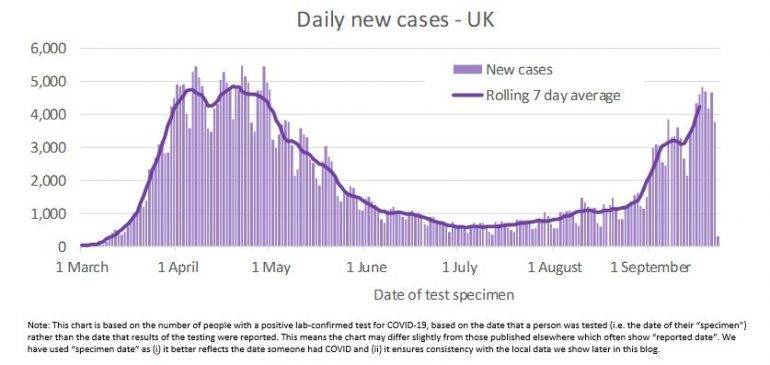
The number of cases across the UK rose rapidly over March, as COVID-19 began to spread though the population. After this initial surge subsided, daily case numbers fell over the summer months, in part as the lockdown restrictions and social distancing measures help suppress transmission rates. However, case numbers have been steadily increasing for the past few months. The concern of public health officials is that we are now seeing “exponential growth” – a rapid rate of increase akin to that seen early on in the first wave.
Care is needed though when looking at this chart. It is tempting to compare the second half of the chart (July onwards) with the early part. This can lead to the false impression that new cases now are running similar to that seen in March and April. Testing capacity was very limited initially and only available to those in a clinical setting. It is very likely that community infection numbers at that time were much higher than shown in the chart. In contrast to March/April, testing capacity has significantly expanded. We are now able to perform around 10-15 times more tests daily1. Owing to “Test ad Trace” we are also testing more asymptomatic individuals now, and the test results will include individuals with virus residues i.e. who have not been infectious for many days and potentially weeks.
There has been a lot of coverage over the past few days on recent issues, such as delays to obtaining test results due to a surge in demand, caused in part by the reopening of schools and many businesses. We can see in the above chart that cases fall sharply in the most recent days. This is primarily as a result of the lag-time in obtaining results, as the figures are based on the specimen date. We would therefore anticipate that the figures for the past few days will increase when we look at the same chart next week.
National vs Local
The focus of attempting to control the pandemic had switched from the initial nationwide lockdown to using more localised approaches, with the intention of only putting in place restrictions in areas where, and for as long as, it is necessary. In areas like Bradford, Bolton, Calderdale and Oldham additional local restrictions have been in place for many weeks. The areas with additional restrictions also notably expanded over the last week, now covering large parts of the North East, North West and the Midlands.
However, we also have seen an escalation of the COVID alert level, and the introduction of some additional national restrictions – most notably a curfew on the hospitality industry, and a strong encouragement to return to working from home. In Scotland and Northern Ireland national restrictions have replaced the restrictions that were in place for specific localities.
Whether we continue along a route of localised restrictions, or instead use more sweeping national restrictions, depends on whether we see case numbers fall. We examine below the available data on case numbers for local areas within in each of the home nations in turn, identifying patterns over the last week and whether there are local areas where additional interventions may be required.
Case numbers in England
Public Health England publishes a weekly surveillance report exploring the national and local new COVID-19 cases data for England. One of the outputs of this surveillance is a “watch-list” of local authorities1 which are causing concern, split into three categories:
- Intervention: These authorities have specific restrictions in place which are more limiting than those in place for England generally i.e. there is some form of local restriction (“lockdown”).
- Enhanced Support: The local authority is gaining additional support and resources from central government, including increasing mobile testing capacity.
- Concern: Highlighted as having high prevalence of COVID-19, the local authority is taking additional targeted actions in order to control COVID-19 case numbers. This can include additional testing in care homes and increased community engagement with high risk groups.
58 local authorities appear on the latest watchlist (published 18th September), covering 1 in 4 of the population of England. Nearly all the additions were trailed in our blog last week. In advance of the publication of the watchlist today, we have updated our analysis based on the latest data on cases and highlight a small number of areas which give cause for concern.
Week on week: Local area differences apparent
The graphic below shows last week’s “case-watch” chart and this week’s chart side by side. We zoom in to this week’s chart later in this blog – the key thing for this chart is the location of the points on the chart, each of which is one of the (lower-tier) local authorities in England.
1 Pillar 1 and Pillar 2 testing – see our earlier blog which explain the Pillars
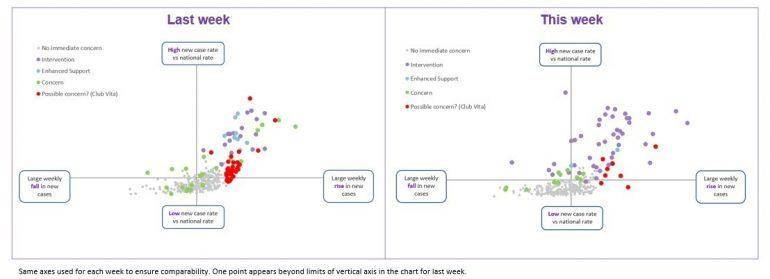
Encouragingly, this week’s chart shows more points on the left side of the chart. This covers over 150 of England’s 315 (lower-tier) local authorities and around 45% of the population of England. In these authorities’ cases have fallen, compared to the cases seen in the previous week.
Focus on this week: Which local authorities might be of emerging concern?
We enlarge this week’s case watch below, and highlight the eight local authorities of possible concern.
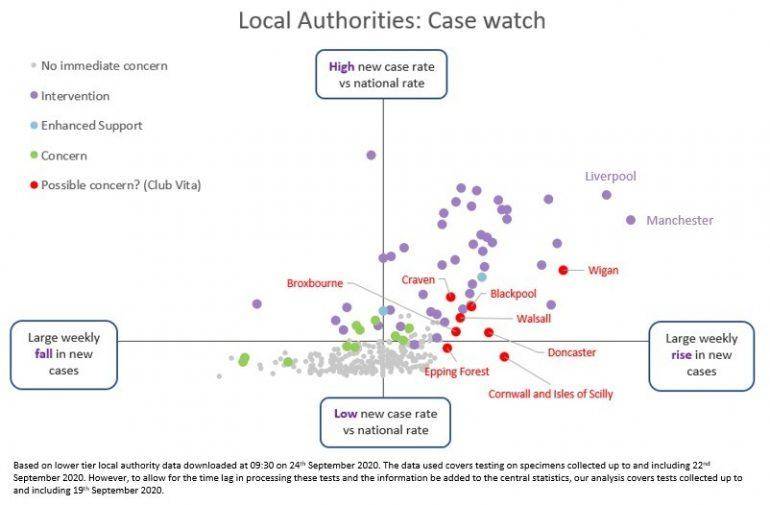
Many of the areas with existing interventions (“lockdown”; lilac dots) have had strong growth in cases appearing to the right on the chart. For areas where lockdown is very new this may be due to the delay in restrictions taking effect. However, given some areas have had “lockdowns” for several weeks, it is concerning to see so many local authorities with interventions in place continuing to see a rise in case numbers.
The chart also highlights how:
- Liverpool and Manchester have seen particularly strong growth in new cases
- Wigan has seen a strong rise in new cases and looks likely to be joining neighbouring authorities in having tighter local restrictions
- Restrictions may be extended to Craven (North Yorkshire), and given the rise in cases in Blackpool, it seems likely that the exemption it previously had from the restrictions in Lancashire will be short-lived.
- There is likely to be concern at the rising cases in Broxbourne, Cornwall and the Isles of Scilly, Doncaster, Epping Forest and Walsall. Whilst they may not be flagged in this week’s PHE watchlist, if cases continue to rise rapidly in these areas then restrictions may be considered appropriate. It is notable that this list includes areas not just in northern England, but also neighbouring areas in the South East (Broxbourne and Epping Forest) and also the far South West
- A small number of areas previously considered of concern (green dots) appear to the far bottom left of this chart and so seem likely to drop off the PHE watchlist (Northampton, Peterborough and Spelthorne)
Case numbers in Wales
Caerphilly saw the first local lockdown in Wales from the evening of the 8th September. Last week further areas of Wales had tighter restrictions imposed. However, like England, there remains a combination of some tightening of national restrictions and more stringent localised restrictions / lockdowns. Details on the local restrictions in force can be found here.
We have updated our analysis of the daily case data for Wales, as published by Public Health Wales, split by the 22 Local Authorities. While there is no Welsh equivalent of the PHE watch list used in England, we nonetheless highlight in the chart below areas with local lockdowns/interventions, as well as those areas where new case numbers / growth in new cases is of concern.
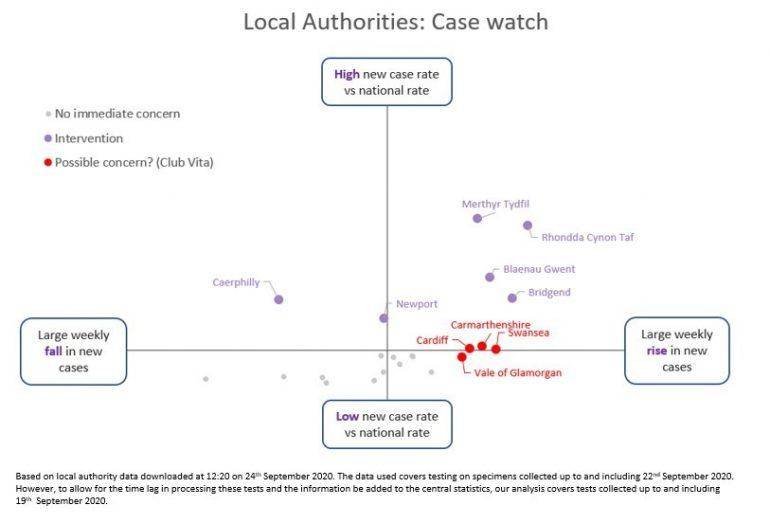
In particular, we can see that:
- Case numbers remain high in the areas with local lockdowns.
- Case numbers are falling in Caerphilly where the local lockdown has been in place for two weeks
- Cardiff, Carmarthenshire, Swansea and Vale of Glamorgan all have high growth in new cases. Whilst the overall level of cases in these areas may not be of concern, if the growth in new cases continues, public health officials may view local lockdown as necessary in those area.
Case numbers in Scotland
Whereas England saw the first local restrictions introduced to Leicester at the end of June, the first local restrictions in Scotland were imposed in Aberdeen on 5th August. While the restrictions in Aberdeen were recently lifted, local restrictions were brought in across a wide part of the Glasgow area from the start of September. Most recently, North Lanarkshire and South Lanarkshire - again both in the Glasgow area - introduced localised lockdowns from 12th September. Since then, these restrictions have been extended to apply across Scotland. It is worth noting that these restrictions differ from those applying in areas of England subject to local lockdown, and that the phased easing of restrictions also mean greater national restrictions remain in place in Scotland than in England, for example on the opening of non-essential offices. (See here for more information.)
We have updated our analysis of the daily case data for Scotland, as published by Public Health Scotland, split by the 32 Council Areas.
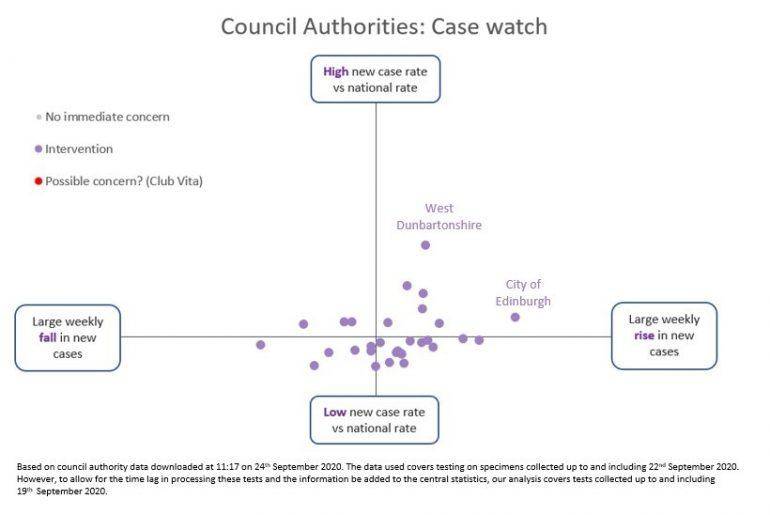
We can see that:
- Case numbers are likely to be most concern in West Dunbartonshire where they remain high; whilst
- The growth in new cases in City of Edinburgh may be of concern
Case numbers in Northern Ireland
On 10th September the Northern Ireland Executive announced that additional localised restrictions were being brought in for specific areas for the first time in Northern Ireland. Rather than implementing restrictions across specific Local Government Districts, they were targeted at more granular areas. The initial restrictions included the Belfast area, Ballymena, and some other specific postcode areas. This was then now been extended to further areas such as Dundonald, with 10,000 postcodes which are covered by local restrictions. Restrictions on households meeting up (including no indoor meetings) now apply across Northern Ireland.
Our analysis of the daily case data for Northern Ireland, as published by the Department of Health, split by the 11 Local Government Districts is shown below.
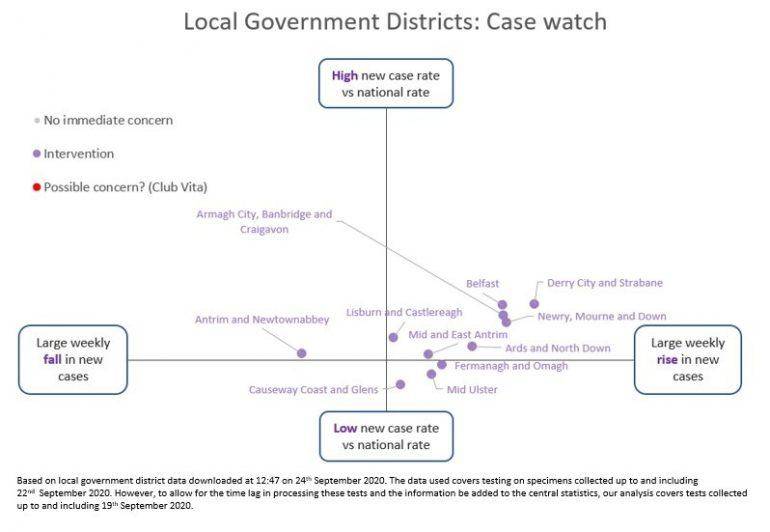
We can see how cases continue to grow in most areas of Northern Ireland, providing context to the recent extension of the restrictions beyond specific postcodes to national restrictions.
Direction of travel
The direction of travel for new cases continues to cause concern, particularly in northern parts of England and in Northern Ireland. We expect a small number of authorities in England will be added to the PHE concern list on Friday, there is also some seemingly good news in that many authorities across England, Scotland and Wales are seeing falling case numbers. Whether, we can continue down a path of localised rather than national tightening of restrictions will depend on the effectiveness of existing restrictions and the confidence in our ability to continue to accurately monitor local case numbers in the face of growing cases and demand for testing.
1For those familiar with the English local authority system these are “lower tier” local authorities – the smallest regional unit where data is readily (and publicly) available.