


The debate raging in actuarial circles is whether the higher mortality levels observed in the national population is a blip or a trend back towards lower rates of improvement. Here at Club Vita we have cautioned against changing course in response to recent data points, and today we are releasing the provisional findings from our own analysis of improvement rates of members of DB pension funds.
30 March 2017
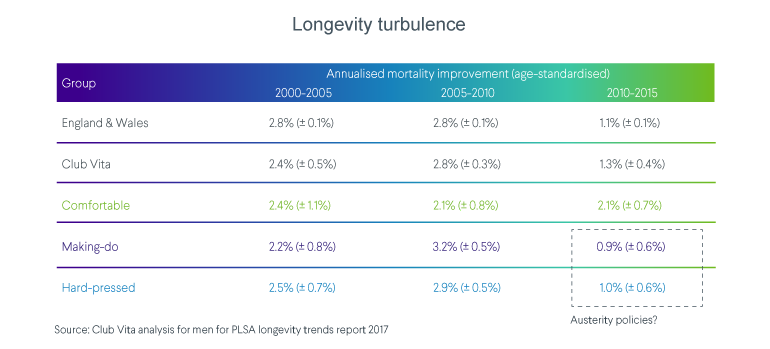
Provisional findings from Club Vita’s latest analysis of longevity improvement rates of members of DB pension funds, split by socio-economic group.
UK longevity improvement rates are attracting attention like never before. John Cridland’s independent review of state pension age and the debate on the funding of care for the elderly show the importance to the political agenda.
Our society has more older people, more older people will lead to more demand for health services and, inevitably, more deaths. This is not really longevity at work, it’s mainly a function of rolling forward the baby booms that followed each of the 20th century’s world wars, has been known for decades and should come as no surprise.
The debate raging in actuarial circles is whether the higher mortality levels observed in the national population is a blip or a trend back towards lower rates of improvement. Pension actuaries are looking for positive news to alleviate the effect of lower interest rates. You might imagine that lower longevity improvements would have a profound impact on funding levels of pension funds, but most actuaries are already anticipating a reversion to slower rates of improvement.
One swallow does not a summer make
Here at Club Vita we have cautioned against sharp changes of course in response to recent data points for three main reasons:
- Longevity improvements before 1990 were a bumpier ride – the 1990s and 2000s were unusual for their smooth upward trajectory;
- Actuaries struggle to justify longevity improvements to finance directors (despite the tapering to lower rates of improvement) - increases are far harder to implement than cuts; and
- Before changing course, understand the drivers of change, and particularly whether the pattern is uniform across the population.
There have been a few important recent contributions to shed light on what’s going on beneath the surface:
- First, the Continuous Mortality Investigation (CMI) has released the latest vintage of its model. The default version of this model is calibrating against recent trends in national population data rather than DB pension fund members. The CMI’s report pointed to a sharp slowdown in rates of improvement at the national average level. Its report also includes analysis of a smaller body of data in the Self-Administered Pension Scheme (SAPS), which shows a contrasting picture of higher improvements.
- Two research reports studying the performance of the National Health Service in recent years as our nation’s ageing population has increased the demand for its services. These suggest that higher levels of “excess” winter mortality may be connected to the capacity of the system to cope.
And today, Club Vita is releasing the provisional findings from our own analysis of improvement rates of members of DB pension funds. We split up our population into three groups of men and two groups of women, which we call VitaSegments. The methodology that we use for allocating pensioners – based on postcodes and pension amounts – can be found here. Very broadly, the Comfortable VitaSegment relates to those pensioners with reasonable levels of DB pension (>£150 pw), the Hard-Pressed those who live in the more deprived areas and the Making-Do being the in-between group.
The key results are for men, who dominate the liabilities of most DB funds.
We’re seeing evidence of a sharp decoupling/divergence of socio-economic groups taking place – see in box in bottom right of the above table. During the noughties decade, we observed slightly higher improvement rates for Making-Do and Hard-Pressed compared to Comfortable. Over the latest 5 years (2010-2015), we’re seeing the opposite. The improvement rates in the Comfortable group have barely changed – an average annual drop of over 2% a year in each of the three successive 5 year periods. This is particularly important for Club members as generally your liabilities are concentrated in this Comfortable group.
So, the exceptionally strong tailwind of improvements observed in the 1990s and 2000s decades has abated. But this has not necessarily turned into a headwind either: the death rates of our groups still fell over the 5 years from 2010-2015 in all three VitaSegments. Instead, we are observing a more turbulent period, and one in which the socio-economic longevity gap could widen again.
Our analysis shows the benefit of subdividing the population into sub-groups and using relevant data to calibrate the leading edge of the projection model.
We have three asks of our Club Vita subscribers:
- Recognise that our population is not uniform in managing your liabilities;
- Consider segmenting the population for assumption setting – the CMI modelling framework which is used pretty much universally by actuaries as a way of expressing assumptions can be calibrated with CV data; and your support is essential to our efforts in shedding light on the underlying patterns; and
- Please continue to supply data to Club Vita annually to monitor trends – with your regular data flows we can update these analyses every year.
Since this article was published we have created a more detailed report, in collaboration with the Pensions & Lifetime Savings Association. You can read the full report here.
Find out more
Find out how our unparalleled insights can benefit your fund