


In previous blogs we have explored the issue of what we called ‘missed’ COVID-19 deaths: the fact that recent weeks have seen a surge in weekly deaths which do not mention COVID-19 on the death certificate. Across the UK we saw some 14,000 such deaths in April alone. A key question is what is driving this pattern, and whether there is any evidence that they could be ‘mislabelled’ COVID-19 deaths.


Underlying cause of death data (Scotland)
One way to explore these missing deaths is to look at the primary cause of death listed on the death certificate. This is particularly easy to do for Scotland.
The National Records of Scotland (NRS) produces detailed information on weekly death registrations. In line with the other national statistics agencies, they publish details of both the total number of deaths registered each week, as well as how many of those deaths mentioned COVID-19 on the death certificate (either as the underlying cause or as a contributing factor). Helpfully though, the NRS figures also include details of weekly deaths by underlying cause, split into 6 categories, along with the corresponding average over the previous 5 years. This enables us to examine the emerging patterns.
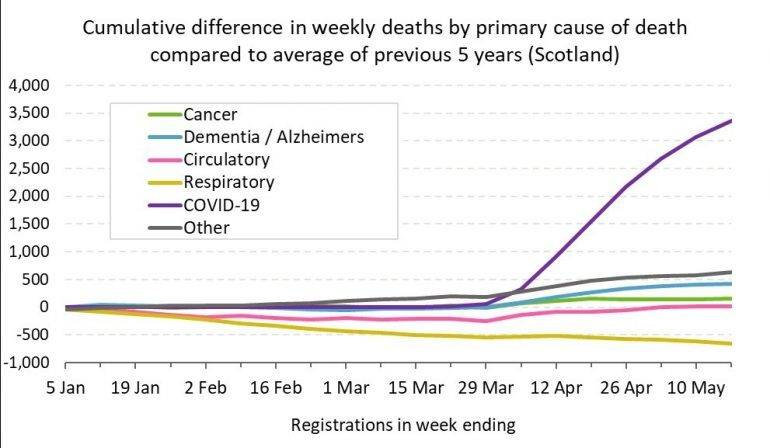
In the period prior to the first COVID-19 deaths were registered in Scotland (week ending 22nd March), deaths in 2020 were lower than the average over the last 5 years, with the cumulative total 584 lower than average by 15th March. This was driven primarily by lower than average deaths attributed to Circulatory or Respiratory diseases, although ‘Other’ deaths were higher than average to that point.
The impact of COVID-19 is clearly seen on the chart above, with 86% of the ‘additional’ 3,926 deaths registered by 17th May having COVID-19 as the underlying (primary) cause of death.
Non COVID-19 excess deaths since end of March
Since 29th March 2020, non COVID-19 deaths (i.e. where COVID-19 is not recorded as the primary cause of death) have markedly increased across most causes. We can see this in the chart below which looks at deaths over the period 30th March to 17th May. It shows both the number of “excess” deaths (above the 5 year average) by cause, and this number as a percentage of the average levels seen over preceding 5 years.
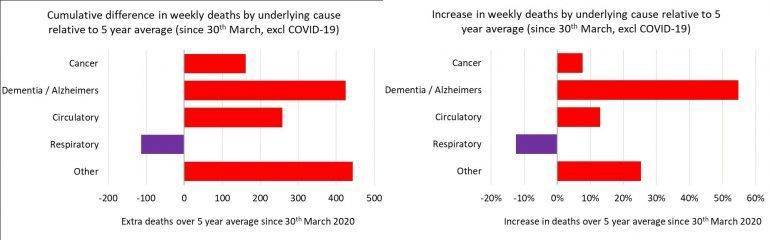
We can immediately see how most of the excess deaths which don’t have COVID-19 as the underlying cause on the death certificate appear to be from the ‘Other’ category, closely followed by Dementia/Alzheimer’s. We can also see how deaths from Dementia/Alzheimer’s have seen by far the largest percentage increase (55%).
Digging deeper into these totals we can see some interesting weekly patterns in the chart below (which also includes the week to 29th March 2020 to provide some context).
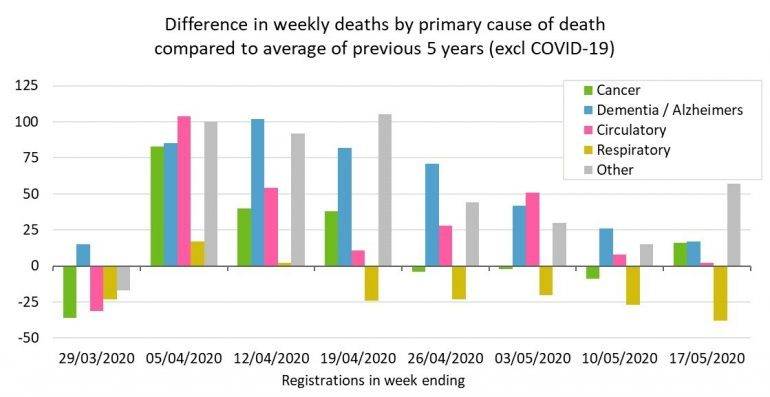
Note as Friday 8th May was a Bank Holiday, some death registrations may have been delayed into the following week
Deaths from all causes jump up noticeably in the first week of April. Looking at this cause by cause, we can see how:
- Cancer deaths returned to average levels relatively quickly, while the reductions in deaths from Dementia and Alzheimer’s have been much more gradual.
- Circulatory diseases have been a bit more volatile from week to week, although still trending downwards over recent weeks.
- Respiratory diseases have been much less impacted, and have generally remained lower than average, as they have been throughout the year.
- The ‘Other’ deaths have continued to be above average, as they have been for the majority of the year to date.
What is driving these cause of death patterns is at this stage somewhat speculative. It is noticeable though that the drop off is (very broadly) mirroring the slow-down in COVID-19 registrations – so perhaps some of the deaths had some COVID-19 contributory element? Alternatively, the relatively quick return to average levels may be positive news that the messaging that the NHS “remains open” has had the desired impact. In due course we may be able to perform a more in-depth post-mortem on these statistics, hopefully bringing in additional evidence from around the UK.
Taking care not to read too much into this…
Care is needed in drawing strong conclusions from these statistics. These relate to deaths where COVID-19 is not listed as the underlying cause of death i.e. the primary reason. Of the 1,177 excess deaths that have been registered since 29th March where COVID-19 is not listed as the primary cause, 178 of these mention COVID-19 on the death certificate as a contributory cause. (For those following our weekly blogs these are included in the “missing” deaths category.) However, this still leaves some 999 ‘extra’ deaths to date and we suspect that the analysis above offers a strong indication as to the likely primary causes of death[1].
Never-the-less, it is reassuring to see that the numbers of both COVID-19 and non COVID-19 deaths are beginning to fall. Although concerns remain that lockdown measures, and associated reductions in non COVID related hospital and GP visits, may unfortunately result in increases in mortality rates from a range of causes in the months ahead.
[1] Note there are some small discrepancies between the data provided in different categories by the NRS
“All of the team at Club Vita wish to extend our condolences to anyone who has personally been touched by bereavement in recent weeks. We know that these deaths leave behind people who are missing loved ones. Our thoughts are with you…”