


As COVID-19 cases continue to grow across much of the country, an increasing number of areas in England are being escalated to the “High” or “Very High” alert levels in the three tier system, with Nottinghamshire and West Yorkshire set to be the next to move to Very High on Friday (30th) and Monday (2nd) respectively. Meanwhile, Scotland is bringing in its own five tier system from Monday, Wales has now implemented its “firebreak” across the country, and Northern Ireland’s “circuit breaker” continues.

In this blog we explore the latest data on case numbers across the various parts of the UK, highlight areas of particular concern, and consider whether there are any early signs that the spread of COVID-19 is slowing in areas with additional restrictions, and if there is evidence that further restrictions should be expanded to other areas.
The overall picture on case numbers
The chart below shows the latest case numbers published by the UK government (as of the afternoon of 29th October). The bars show the daily numbers of new COVID-19 cases across the UK, whilst the line shows the running seven-day average, smoothing through dips in new case numbers which tend to happen at weekends and bank holidays, for example.
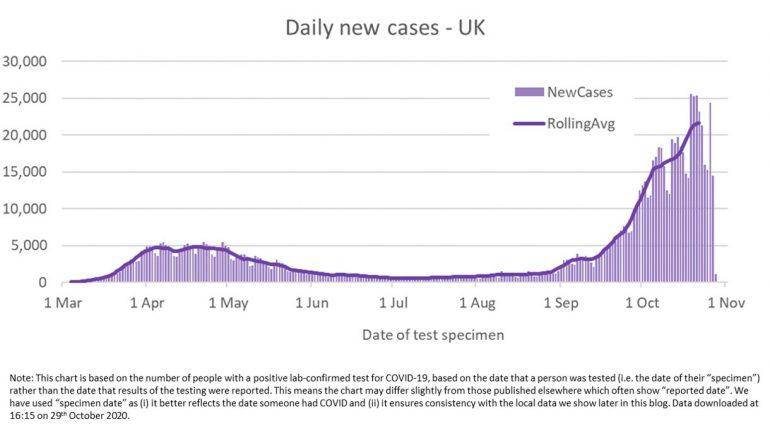
It is important to note that case numbers over recent months (on the right of the chart) are not directly comparable with those from earlier in the pandemic (the left of the chart), due to the significant increase in testing capacity (which is now 10-15 times higher1 than at the start of the pandemic), more asymptomatic individuals now being tested, and positive test results now include individuals with only virus residues.
The sharp drop in more recent days shown in the chart is primarily due to the time-lag in obtaining testing results, as the figures are based on the specimen date. The analysis below therefore ignores the data for the most recent days, and ‘steps back’ by 4 days.
In our recent blog we discussed how the rate of growth appeared at time to be slowing somewhat. However, over the most recent week it appears to be accelerating again. Given the tighter restrictions now in place across large parts of the country, this is clearly concerning.
Our “case-watch” for England
The graphic below compares this week’s “case-watch” to the previous week – with each point representing a (lower-tier) local authority2 in England. The best-case scenario would be for points to appear in the bottom left, indicating falling case numbers and suppression of the virus. If points appear to the right of the vertical line, case numbers are rising – what we don’t want to see is points primarily to the right, and especially not heading towards the top right (high, and rapidly growing, case numbers) as this suggests the potential need to move away from localised restrictions to nationwide restrictions in order to “put the brakes on.”
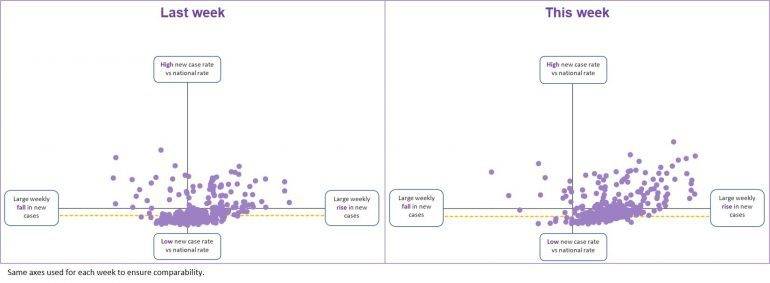
The key change between the two weeks appears to be that there are now more local authorities who are seeing rises in new cases (the right hand side of the chart). The number of authorities on the right of the chart has increased from 210 to 290, and now covers around 92% of the population of England (compared to 67% last week), which is a cause of concern.
Focus on this week: The 3-tier system
The three-tiered system for local restrictions has now been in place for several weeks in England. The relevant restrictions of each tier are set out in detail on the government website, but in summary:
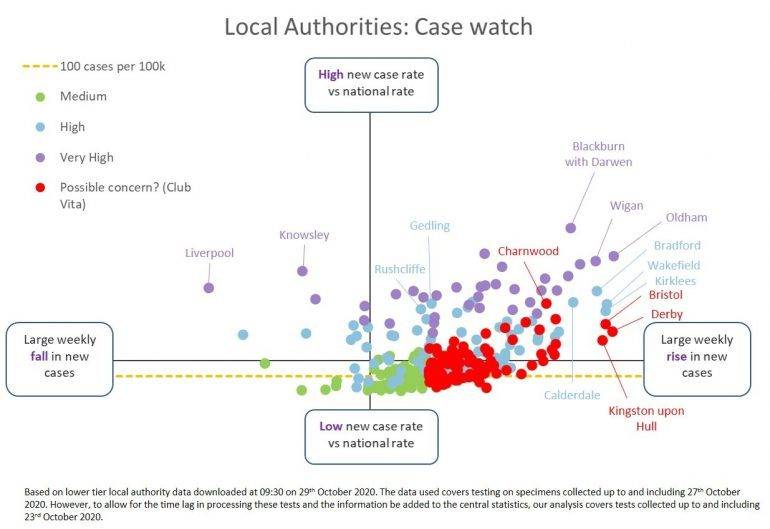
- Medium: This is the baseline for restrictions, which were previously in place at the national level. This includes measures such as the ‘rule of 6’ and some hospitality restrictions after 10pm. We mark areas currently in the level with green dots in our chart below (although some are instead marked in red, representing areas which are causing us concern and may require a higher alert level in the near future).
- High: This is for areas with higher weekly new case rates. It has been widely reported (but not officially confirmed) that the threshold for escalation from Medium to High alert level is over 100 new cases per 100,000 people. The greater restrictions include no household mixing in any indoor setting (light blue dots)
- Very High: Highlighted as having a very high prevalence of COVID-19 requiring additional restrictions. Our understanding is that the exact restrictions imposed on any authorities in this category will be selected from a wide reaching menu, subject to negotiations with local government, but as a minimum, local authorities are likely to see tighter restrictions on the hospitality sector, such as closing of pubs/bars, and bans on household mixing extended further to include outdoor areas. These areas are marked in lilac on our chart.
The list of areas in each region is published on the government website, and, as at 12pm on 29th October, the in-force list currently names 88 local authorities in the High category (covering ~38% of England’s population) with 35 local authorities classified as Very High (with Greater Manchester, South Yorkshire and Warrington joining Liverpool and Lancashire in this tier over the past week) – the remaining local authorities are currently in the Medium classification. The 8 local authorities in the Nottinghamshire area are moving to Very High from Friday (30th) with the 5 local authorities in West Yorkshire set to move to Very High on Monday (2nd).
Focus on this week: Which local authorities might be of emerging concern?
Doncaster in South Yorkshire has seen such a large rise in case numbers that it is beyond the end of the horizontal axis. South Yorkshire was moved to Very High status from last weekend, and we can understand why based on the latest figures for Doncaster.
It is also clear why it has been decided that West Yorkshire will move to Very High next week – four of the five council areas (Bradford, Calderdale, Kirklees and Wakefield) have seen large increases in cases over the past week.
Despite the imminent move of the Nottinghamshire area to Very High, Nottingham City itself has seen a sharp fall in case numbers (to the extent that it is not shown on the chart as it is to the left of the x-axis). However, despite this fall, the case rate in the area, as well as in other parts of the county such as Gedling and Rushcliffe, remains relatively high, comparable to many other areas which are already in Very High status.
Blackburn with Darwen in Lancashire continues to see high case rates and growth. Lancashire moved to Very High alert from 17th October, so local authorities will be hoping the tighter restrictions begin to slow the growth in the near future.
Meanwhile Wigan and Oldham have also both seen high case rates and growth over the past week. They are both in the Greater Manchester area, which was (somewhat controversially) moved from High to Very High last week.
In slightly better news, Liverpool and nearby Knowsley have again seen a fall in cases over the past week, although case rates remain higher than the national average. The Liverpool area was the first region to be placed in the Very High category, so it could be that the strengthened restrictions are beginning to have the desired impact.
The “case-watch” chart above also marks a number of local authorities in red. These are areas currently classified as Medium risk, but which give cause for concern, either due to high case numbers or very high (and statistically significant) growth in the new case rate. Of these, the Kingston upon Hull, Bristol and Derby all show high increases in cases compared to last week, while Charnwood again saw relatively high growth. It is therefore unsurprising that, as we were going to press, it was announced that Kingston upon Hull, Derby, and Charnwood would be amongst a list of 16 areas which will be moved to the High alert level from Saturday (31st)
The national weekly new case rate for week ending 16th October was 173 per 100,000 people, well above the believed threshold for High alert status. The weekly new case rate for the week ending 23rd October was 224 per 100,000, a 29% increase over the previous week. This is significantly higher than the increase over the week before and suggests that the rate of growth of the new case rate is accelerating again, which would be a cause for concern.
All the local authorities categorised as Very High risk (lilac dots), and 82 of the 88 local authorities currently categorised as High risk (blue dots) have cases greater than 100 per 100,000. There are also 112 areas which are currently on Medium alert but sit above the yellow line. It will be interesting to watch developments in the next few weeks to see whether any more of these regions of possible concern, as well as those above the yellow line, are moved to the High alert level.
Case numbers in Wales
We have updated our analysis of the daily case data for Wales, as published by Public Health Wales, split by the 22 Local Authorities. There is no Welsh equivalent of the 3-tier alert level now used in England, but a nationwide “firebreak” is now in force until 9th November. We highlight in the chart below areas where new case numbers / growth in new cases is of concern. Note that as some areas have relatively small populations, the results can be quite volatile from week to week.
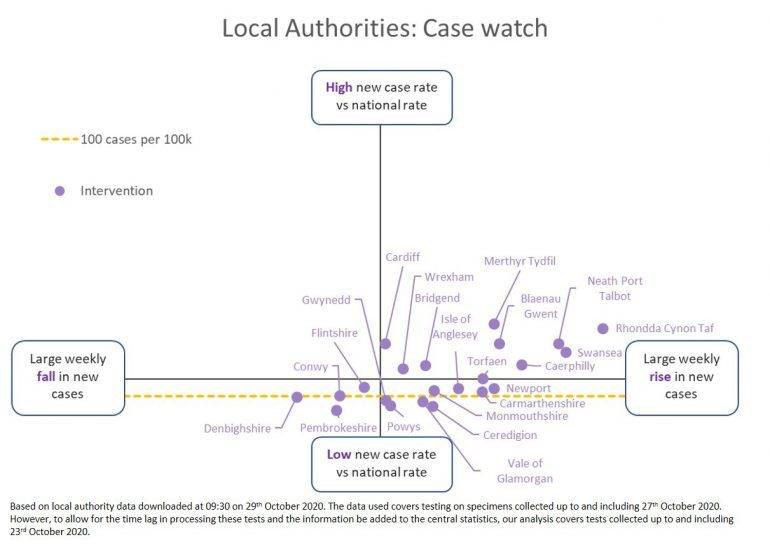
Case numbers in Rhondda Cynon Taf have risen significantly over the past week, while Merthyr Tydfil has an even higher new case rate. Meanwhile, although Cardiff still has a relatively high new case rate, it has been relatively stable over the past week.
Overall, new case rates are similar in Wales to England – running at 229 per 100,000 lives in week to 16th October, up from 178 in the week before. 16 of the 25 local authorities in Wales fall above the 100 per 100,000 people weekly new case level, covering ~78% of the population.
Case numbers in Scotland
There are currently a range of restrictions on the hospitality industry in Scotland, with particularly tight restrictions across the central belt. These restrictions have been extended for another week. In the meantime, the Scottish Government is introducing a five-tiered alert system, similar to that introduced previously in England, with effect from 2nd November.
We have updated our analysis of the daily case data for Scotland, as published by Public Health Scotland, split by the 32 Council Areas.
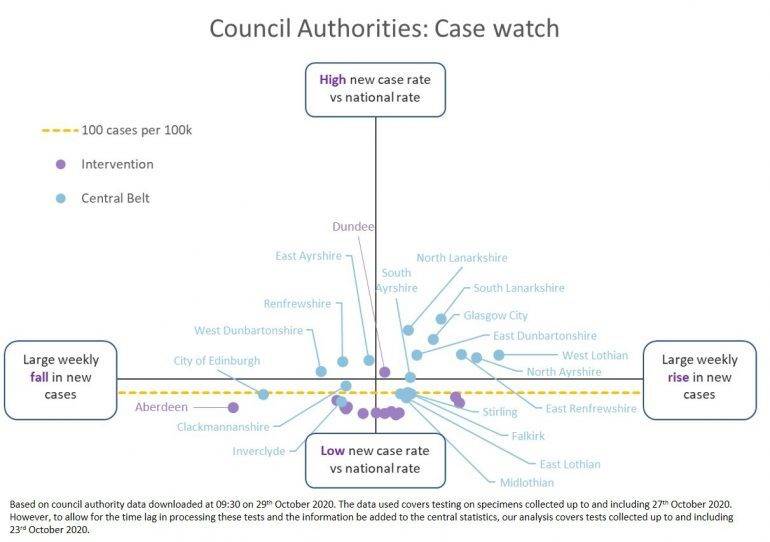
Scotland continues to have the lowest weekly new cases amongst the home nations. For the week up to 16th October (which determines level of x axis in the chart) there were 156 new cases per 100,000. For the week to 16th October this had increased to 166 per 1000,000, largely driven by continued case growth in the central belt.
We can see from the chart that:
- While cases are rising across much of the country, 12 council authorities, covering around 36% of the population, have seen decreases since the previous week.
- In particular, the City of Edinburgh has again seen a marked fall. While it is due to be placed in Level 3 with the rest of the central belt under the new tiered system next week, health authorities considered setting it at the lower Level 2. If cases continue to fall, it may be amongst the first areas to be ‘downgraded’.
- Dundee is the only area not in the central belt to be placed in the higher Level 3, and we can see why, as it is the only such area to exceed 100 cases per 100,000 lives.
- Aberdeen was the first part of Scotland to see a local lockdown on 5th August. Locals will no doubt welcome the recent fall in cases, and the relatively low new case rate.
- Neighbouring North Lanarkshire and South Lanarkshire have both continued to see strong growth in cases and have had the highest case rates in Scotland for several weeks. It is thought that consideration was given to placing them in the highest tier under the new alert system, although ultimately it was decided to assign them to Level 3 with the rest of the central belt.
Case numbers in Northern Ireland
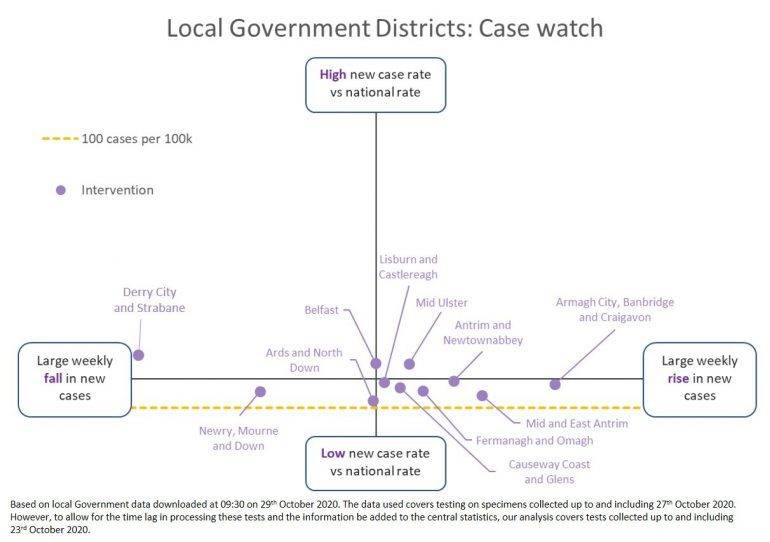
The ‘circuit-breaker’ lockdown has now been in place in Northern Ireland for two weeks, and is due to last for a further two weeks. However, nearly every local government district has again seen increases in cases numbers, and all are above the 100 cases per 100,000 level.
Newry, Mourne and Down continues to see falling case rates, which is encouraging. Also, the Derry City and Strabane area, which has frequently seen the highest case rates across the UK over recent weeks, has seen a welcome fall in cases over the last week (although it remains the highest rate in Northern Ireland). Meanwhile the Armagh City, Banbridge and Craigavon area has seen an increase in cases, although the case rate is close to the national average.
The weekly case rates in Northern Ireland continues to be much higher than those in the other home nations. However, this case rate has been stable over the past week at around 374 per 100,000 people in the week to 23rd October. Could this be a sign that the circuit breaker is helping stem the surge in cases? The next week or two might give us an indication as to whether this is the case.
Notes:
1. Pillar 1 and Pillar 2 testing – see our earlier blog which explain the Pillar
2. For those familiar with the English local authority system these are “lower tier” local authorities – the smallest regional unit where data is readily (and publicly) available.