


As COVID-19 (the disease caused by coronavirus SARS-CoV-2) continues to spread round the world, there is an understandable focus on death numbers to help gauge the impact. We explore below why this is not an exact science, and why numbers of deaths can and do vary.

In my previous blog I explored the background to COVID-19, and the potential impact on pension schemes. Clearly a lot has changed since the blog was published at the end of February, with the virus now having a big impact in many countries around the world, and the global death toll approaching 130,000. At the time of writing (21st April) the UK is number 5 on the list of deaths (behind the US, Italy, Spain and France) with a published value of just over 16,500 reported deaths. While undoubtedly useful for context, it is important to consider where this number comes from, and how close it might be to the ‘true’ figure.
Headline death numbers
The headline death figures for the UK (broken down into constituent countries) are published daily on the UK government website. As each country has responsibility for reporting its own figures, there are a number of differences in approach:
- England & Wales both report deaths as at 5pm on the day before publication, but figures for Scotland and Northern Ireland are as at 9am and 9:15 am respectively.
- Deaths for England are only those that occurred in hospitals where the patient tested positive for COVID-19. In Scotland and Northern Ireland the figures include all registered deaths (regardless of location) but again only those who have tested positive for COVID-19. While in Wales the figure includes suspected COVID-19 cases (regardless of location).
In each case the deaths recorded (and daily increase) are based on the date they were reported, not the actual date of death.
ONS data – alternative figures
The ONS has for many years provided weekly information on deaths in England & Wales.
These weekly death figures are based on date of registration rather than date of death, so there is typically a slight delay between deaths occurring and being reported, and factors such as bank holidays can also impact on a given week’s figures.
Given the circumstances, they have recently expanded the information provided each week to include details of deaths linked to COVID-19. In contrast to the headline government statistics, the ONS figures include all deaths where COVID-19 is mentioned on the death certificate, so will include both deaths that occur outside of hospitals and those where COVID-19 may be suspected but not confirmed by a test.
In addition the ONS provide more detailed analysis of COVID-19 linked deaths, including daily deaths by both date of death and date of registration. They also provide daily death figures (by date of death) that were registered more recently (by 18th April for the most recent data at time of writing).
The chart below compares the cumulative deaths from these different sources.
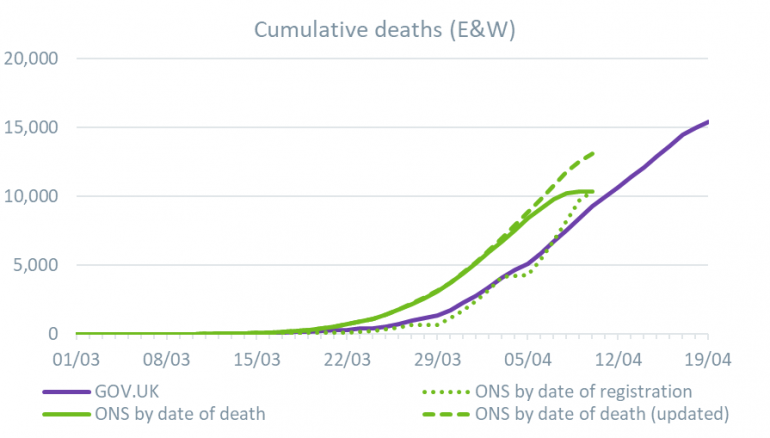
The cumulative death figure for England & Wales for 10th April 2020 can vary from 9,288 to 13,121 depending on the source and the approach to dates.
While there are (known) issues with the government figures, as they exclude deaths outside of hospital (in England), they have the advantage of being much more up to date – while we only have ONS statistics to 10th April, we have government values up to 19th April (as shown by the prolonged purple line in the chart).
In contrast, the ONS figures are more ‘accurate’ as they include a wider range of deaths, but have the disadvantage of taking longer to prepare.
We can however use the comparative figures to assess how the picture is likely to evolve over time.
Analysing the ONS data
As noted above, the headline government figures (for England) only include deaths in hospitals. The ONS have also provided analysis of the location of the deaths for England and Wales (based on deaths registered by 10th April), as shown in the chart below.
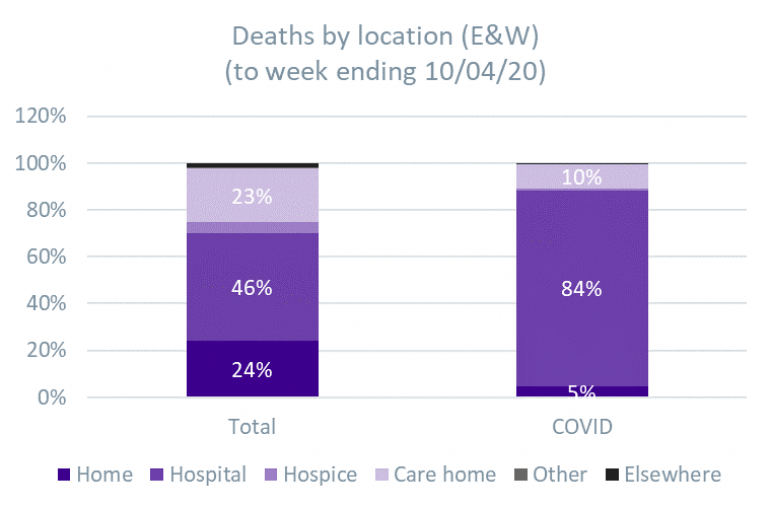
We can see that (perhaps unsurprisingly) the vast majority of deaths associated with COVID-19 occur in a hospital (significantly higher than for all deaths). This suggests that the government figures (which exclude non hospital deaths) may understate death numbers by around 16%.
Although the corresponding figures in Scotland (published by the NRS) are a bit different (based on deaths to 12 April) – where only 62% of COVID-19 deaths were in a hospital setting, with around a quarter in care homes.
How the proportion of deaths occurring out with hospitals varies will be a key factor in determining the size of the variation between the headline numbers and the more detailed ONS death figures.
Impact on population deaths
As mentioned in our recent Top Chart, the spike in deaths in recent weeks has reversed the trend of low deaths in Q1 of 2020, relative to the average over the previous 5 years. However, it is not as simple as just blaming the impact of COVID for this change in direction.
In the chart below we compare the cumulative weekly deaths in England & Wales to the corresponding 5-year average, and also show the equivalent cumulative deaths after removing the COVID related deaths (the dashed line).
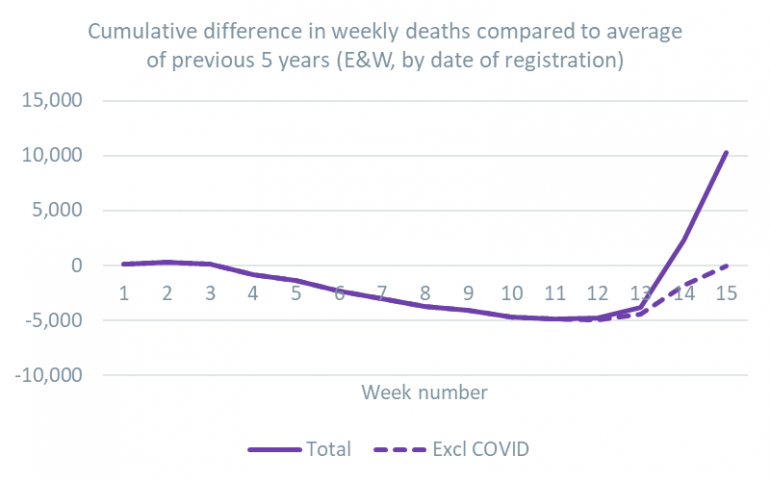
We can see that, while the main driver is undoubtedly the COVID effect, even ignoring this the past few weeks have seen a jump in reported deaths.
There may be numerous reasons for this – for example people may be putting off visiting GP/hospital when they would have otherwise have gone, or there may be localised issues with ICU availability, or even some misrecording of deaths.
Impact on pension schemes
When considering pension schemes, there are three key areas to consider:
- Impact on pension payroll of ‘extra’ deaths, and in particular the ages and socio-economic profile of any such deaths;
- How to adjust base mortality rate tables (such as VitaCurves); and
- How to adjust assumptions around future improvements in mortality rates.
The impact of each of these is likely to vary significantly for individual pension schemes, depending on factors such as the age and socio-economic profile, location and industry.
In addition, the extent of any necessary adjustments to assumptions around base mortality and future improvements will very much depend on the ultimate impact of the pandemic, including factors such as the extent/availability of any vaccination programme, and whether it is expected to be a one-off or a recurrent event.
We will be sharing a more detailed analysis of these various factors and exploring the potential impacts in the near future.
In addition, we will shortly be sharing details of the third in our series of webinars on the issues around the pandemic.
Counting the cost of Covid-19
Download a print friendly version of this article.