


Given the continued extreme mortality seen in 2021, the CMI have made a further refinement to their model to allow users to adjust the weight given to both 2020 and 2021 data.
The CMI (‘Continuous Mortality Investigation’) has for a number of years produced annual updates to its Mortality Projections Model, which is the standard tool used by pension schemes and insurers to estimate future improvements in UK life expectancy. The CMI_2021 model has just been published, which includes England & Wales population experience data up to 2021.

How the model works
The model uses population data from England & Wales to estimate future improvements in life expectancy. It first estimates the current mortality improvements (called the Initial Rate) from recent trends. These improvements are then assumed to evolve over time to eventually reach a Long-Term Rate of improvement. The Long-Term Rate is set by the user, who can also adjust the level of the Initial Rate (for example to reflect the pension scheme populations that the improvements are being applied to, which may have quite different characteristics than the general population underpinning the model), as well as the shape and time taken to get from the initial rate to the long term rate.
How has the pandemic impacted mortality?
2020 saw extreme mortality experience as a result of COVID-19. The headline annual rate of improvement observed in the England & Wales population data was -14.7% for men and -12.4% for women1 (i.e. mortality rates increased significantly over the year). This was the biggest year-on-year increase since 1929, and resulted in mortality rates equivalent to 2008 levels. While 2021 was also a relatively extreme year (with mortality 8.6% heavier for men and 7.8% heavier for women than in 2019), it was less extreme than 2020, with some ‘unwinding’ of the increase in mortality rates seen in 2020.
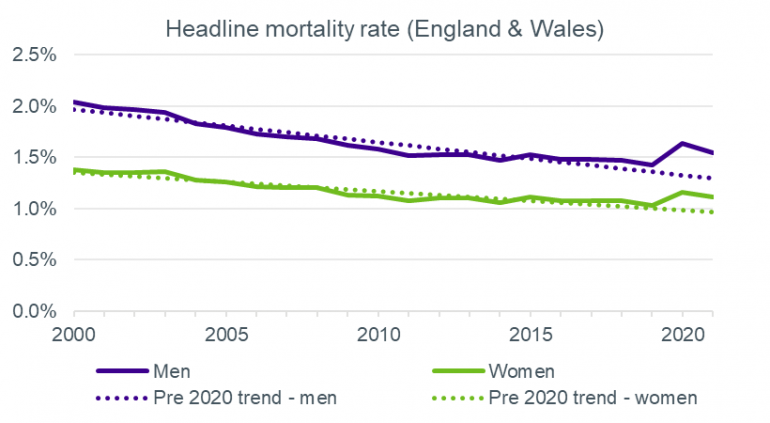
1 Note these falls in 2020 are slightly higher than stated when the CMI 2020 model was published, as the CMI’s estimates for deaths and exposures in 2020 have been replaced by actual ONS data
Controlling the impact on the model
The CMI introduced a new extended parameter in the CMI_2020 model which allowed users to explicitly adjust the weighting given to 2020 data. The ‘core’ setting of the model placed no weight on 2020, so it had no impact on the derivation of the initial rate.
In the CMI_2021 model, which also includes 2021 data, they have extended this approach to also allow the weighting given to 2021 to be adjusted by users, again with a core setting which gives no weight to 2021 (or 2020).
Without these adjustments to the core calibration of the model, the resultant projection would assume negative improvements in mortality persist well into the future (as shown in the dashed line in the chart below). Therefore projected life expectancies would have decreased significantly over the past two years (cohort life expectancies at 65 would fall, relative to the CMI_2019 model, by around 1.6 years for men and 1.1 years for women 2). This would be equivalent to a decrease of around 5% to 7% Technical Provisions3
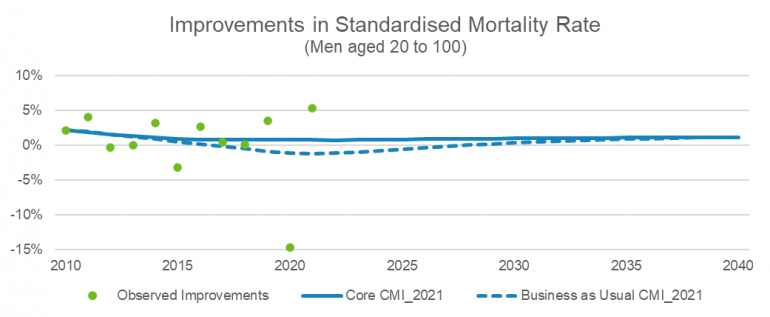
By excluding 2020 and 2021 experience, the model no longer assumes negative improvements occur (as shown in the solid line in the chart). While life expectancy is still lower than predicted under CMI 2019, it is only marginally so, by around 6 weeks for men and 4 weeks for women2. As a result, Technical Provisions would only fall very slightly, by around ½%3. The slight fall is essentially due to the year in which the long-term rate is reached being 2 years later than under the CMI_2019 model.
The impact of moving from CMI 2020 to CMI 2021 is very small under a core calibration – reducing liabilities by in the region of 0.2%3.
2 Based on a life aged 65 in 2022, using S3PM/FA base tables, with a 1.5% long term rate and otherwise core settings
3 Based on single life annuities with 0% net interest rate, at age 65 in 2022, using S3PM/FA base tables, with a 1.5% long term rate and otherwise core settings
Adjusting mortality improvements for pension schemes
The CMI encourages users of their Model to consider the population that improvements are being applied to when calibrating the model. Pension scheme members are typically healthier than the general population, and scheme liabilities tend to be dominated by the more affluent, less deprived individuals. Such individuals have been more resilient to the general slowdown in improvements seen in recent years4. As such, pension schemes typically use the ‘initial adjustment to improvements’ parameter of the CMI model to increase the initial rate above that obtained from population data.
Schemes will also now be considering how to reflect the impact of the pandemic in setting mortality assumptions, as well as the more direct impact on pensioner payrolls of any increase in deaths in the scheme. The addition of weighting parameters for 2020 and now 2021 allow users to reflect their own views of whether to, for example, adopt core CMI_2021, so make no allowance for 2020 or 2021, or make some partial allowance.
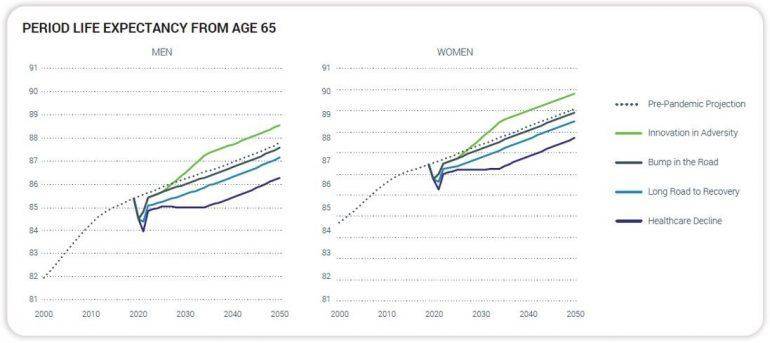
In doing so, they will need to consider the interaction with the chosen base mortality tables, as well as their views on how the pandemic is likely to evolve in the short, medium and longer term, and how their scheme’s characteristics will influence the impact of the pandemic (for example the socio-economic and geographic mix, as well as the age profile). Scenario analysis is a very useful tool as part of a pension scheme’s risk management framework. The charts below are taken from Club Vita’s COVID-19 longevity scenarios white paper, showing how period life expectancy might evolve under a number of outcomes.
At Club Vita we keep a close eye on the emerging statistics, and provide our member schemes with detailed analytics to enable them to make appropriate adjustments to the CMI model based on their mix of members.
4 See CMI Working Paper 159