


2019 saw the biggest fall in mortality since 2011. This leads to higher projected improvements in the new CMI model.
6 March 2020
The CMI (or Continuous Mortality Investigation) is an organisation which carries out research into mortality and produces tools that are widely used by UK actuaries. One of these tools is their Mortality Projections Model, which is widely used by pension schemes and insurers to estimate future improvements in UK life expectancy. The CMI_2019 model was released in early March 2020.
How the model works
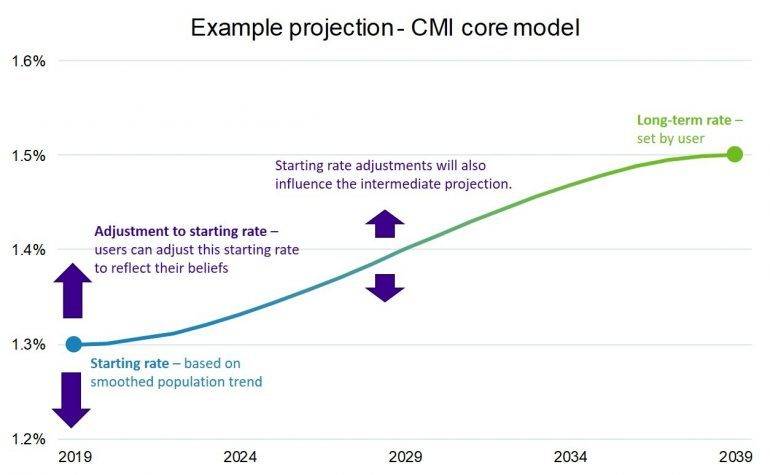
The model uses past population data from England & Wales to estimate future improvements to life expectancy. It has two key inputs. The first of these is an estimate of current mortality improvements (called the Initial Rate). This is based on smoothed recent trends. The second is the Long-Term Rate of improvement. This rate is assumed to apply once those recent trends have run off. The Long-Term Rate is set by the user, and users are also able to adjust the level of the Initial Rate. Separate projections are generated for men and women.
How has including data for 2019 impacted the model?
2019 was a good year for improvements in life expectancy. A headline rate of improvement of 3.8% was observed in the England & Wales population. This was the biggest year-on-year improvement since 2011 and well above the recent average. This means that the Initial Rate under the CMI_2019 model is slightly higher than it was under CMI_2018. This in turn leads to a slightly higher level of projected future improvements (of the order of an increase of 0.3% to 0.5% in Technical Provisions).
A closer look at recent population trends
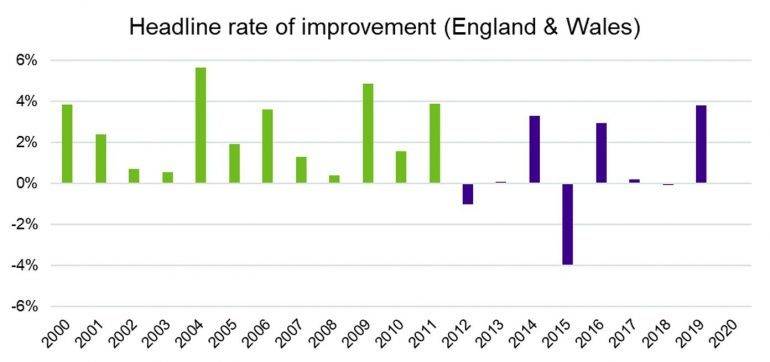
The CMI model sets its Initial Rate based on smoothed mortality improvement trends. Whilst 2019 was a good year, if we look at mortality improvements since 2011, we see that they have been much lower than during the period up to 2011. The 2000-11 average improvement was around 2.5% p.a. compared with 0.7% p.a. for the period since 2011.
This means that even after we allow for 2019 data, the Initial Rate under the CMI model is still much lower than before the post-2011 slowdown. It will take a series of “good” years like 2019 to shift the Initial Rate upwards significantly.
Does the 2019 data signpost another change in trend?
It is too early to say for sure, but it is most likely that the high level of improvements seen in 2019 represent a period of catch up after the close to zero improvements seen in 2017 and 2018. However, it is reassuring after two very slow years to see that, despite the headlines, population improvements haven’t ground to a halt. We will continue to monitor the data and provide regular updates.
The emerging Coronavirus crisis could have a material impact on 2020 mortality rates. If this proves to be the case, actuaries will need to think hard about how to allow for 2020 data in their projections.
Are population-based trends relevant to my scheme’s members?
This is an important question. Evidence from Club Vita, the Health Foundation1and the CMI all show that people living in less deprived areas or who have larger pensions have seen a bigger increase in life expectancy in recent years.
This means the estimated level of current improvements in the England & Wales population is probably an underestimate for most pension schemes. Pension scheme liabilities tend to be dominated by more affluent, less deprived individuals who have built up substantial pensions.
The CMI has urged users of their Model to ensure that they use Initial Rates that are appropriate for their specific population. Membership of Club Vita provides you with analytics to enable you to perform an adjustment to the CMI model appropriate for your mix of members.
1 See Mortality and life expectancy in the UK and the Marmot Review 10 Years On
The CMI_2019 Mortality Projections Model
Download a print friendly version of this article.