


The latest data from the ONS shows a big drop in life expectancy during 2018-20 compared with during 2017-19.
Given the impact of the COVID-19 pandemic, which is reflected in the latest figures, this is unsurprising. However, digging into the detail, there continue to be large discrepancies in the emerging trend at more local levels.
The ONS (‘Office of National Statistics') produces annual updates on period life expectancy in the UK – the so-called National Life Tables. The latest tables are based on the 2018 to 2020 period, and therefore are the first to pick up the impact of the COVID-19 pandemic. Given the significantly increased death rates seen in 2020, this fall in life expectancy is not unexpected. However, it is important to note that the headline figures hide a wide variety of underlying impacts at a more granular level.
Increases in period life expectancy from age 65

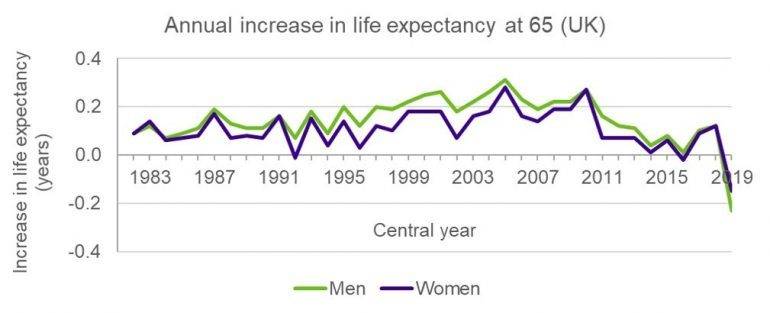
Comparing the annual increase in period life expectancy at 65 over successive 3-year periods, we can see that life expectancy saw fairly steady increases over the 2000s, before slowing over more recent years. The 2018 to 2020 period (marked as 2019 on the chart) saw a marked reduction of around 12 weeks for men and 8 weeks for women compared to the preceding 3 year period.
This is the first time that we have seen such a significant fall in life expectancy since tables began to be published in the early 1980s (although female life expectancy has seen some very small decreases previously), and has resulted in life expectancy values that are similar to those seen during 2014 to 2016 (so effectively removing 4 years’ worth of improvements).
It is important to note that, as these figures are ‘period’ life expectancies, they ‘lock in’ the high mortality seen in 2020, with no allowance for any future improvements in mortality rates. Given the high death rates seen in 2020 and into 2021, we might expect to see some ‘bounce back’ in lower death rates in the short term, as and when COVID-19 moves to being more endemic. Alternatively, we may see the impacts of long COVID, as well as delays to other medical treatments, result in a ‘drag’ on improvements over the short to medium term.
How do the countries of the UK compare?
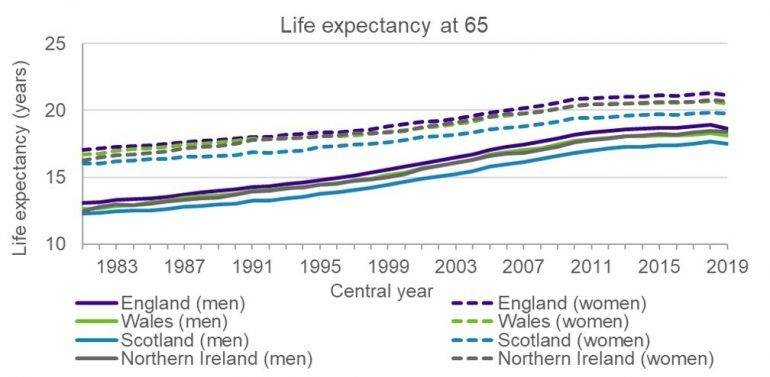
We can see that life expectancy is highest in England and lowest in Scotland for both men and women throughout the period over which life tables have been published. However, this gap has closed slightly in the most recent period, as life expectancy fell by more in England (13 weeks for men and 8 weeks for women) than in Scotland (7 weeks and 4 weeks for men and women respectively). There remains a significant gap however, of 1.2 years for men and 1.4 years for women.
The reason for this ongoing gap (the so called ‘Glasgow effect’) is not fully understood, but is likely to be in part at least due to a combination of differences in socio-economic and lifestyle factors such as smoking prevalence, diet, affluence etc.
Variations by local area
There are also marked differences at a more local level. Comparing life expectancy at birth across the local areas, we can see that life expectancy in the shortest lived areas of the UK in 2018 to 2020 is below that seen in the longest lived area over 2001 to 2003, even before the impact of the pandemic.
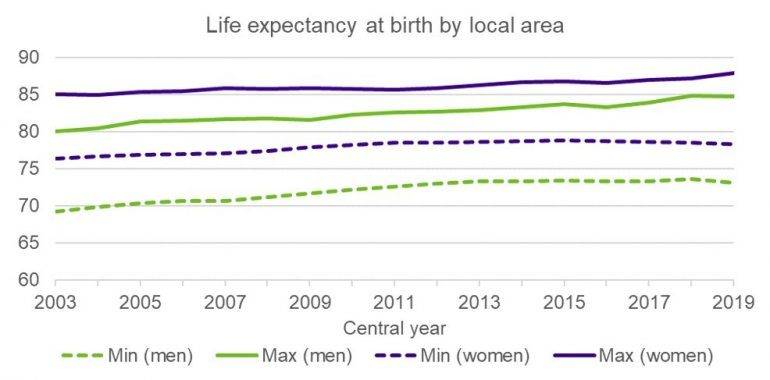
The least well-off areas have seen fairly flat life expectancy in recent years, while more affluent areas have seen steadier increases. As a result, the gap between the shortest- and longest-lived areas, having narrowed somewhat over the late 2000s, has widened again more recently.
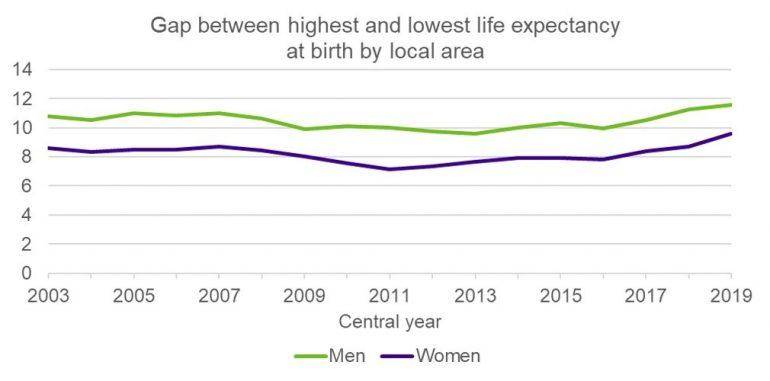
The pandemic is likely to have continued this widening of the health inequalities between the shortest- and longest-lived areas. While the impact of the first wave was fairly uniform across the socio-economic spectrum, it appears from our analysis that the later waves may have had a disproportionate impact on the lower socio-economic groups.
Impact on pension schemes
From a pension scheme perspective, it is important when looking at population level statistics to consider how the socio-economic mix of the scheme’s membership compares to the general population. As we have seen there are wide variations in life expectancy at a local level. At Club Vita our lifestyle profiling is applied at the postcode level, so is even more granular. In setting assumption for future improvements, it is also important to allow for the scheme’s profile, and likely differences in experience. While the impact of the pandemic in the short, medium, and longer term remains uncertain, it can be useful to consider a wide range of potential scenarios, to help access the resilience of the scheme to the future.