


In this week’s blog we explore the latest data on weekly deaths, which continues to trend downwards towards average levels. In addition, we examine how registered deaths varied by age band, highlighting some noticeable differences between genders, and the distribution of deaths which don’t mention COVID-19 on the death certificate.

Weekly deaths continue downwards trend
The latest statistics from the ONS include detailed breakdowns of deaths registered in England & Wales up to 29th May. In particular, they identify deaths where there is any mention of COVID-19 on the death certificate. Combining this information with similar data from the corresponding statistical bodies in Scotland and Northern Ireland, we can examine emerging patterns in the data.
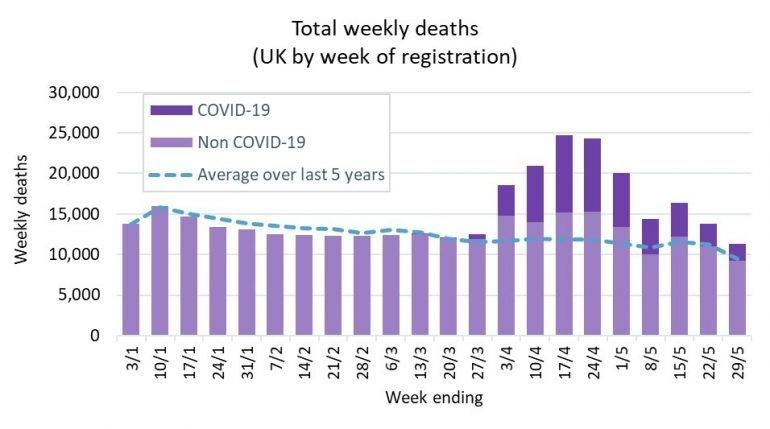
It is encouraging to see that the latest data shows a further reduction in the weekly death registrations; and deaths which mention COVID-19 on the death certificate have also continued to fall. The Monday Bank Holiday on 25th May will reduce death registrations slightly (as seen in the average line too), but we would anticipate the impact to be less significant than the VE Day Holiday on the 8th May. (By virtue of that bank holiday being on a Friday, the “catch-up” in registrations could not happen in the same week and so was delayed to the next week in the chart.)

Weekly figures for Scotland use a different definition of weeks, running from Monday to Sunday rather than Saturday to Friday. The chart above is based on using the Scottish data for the week ending on the Sunday immediately after the date shown on the horizontal axis.
The light mauve bar in the chart above is the deaths which do not mention COVID-19 on the death certificate. These deaths have remained slightly below the average for the latest reported week.
It is reassuring that these deaths remain close to average levels, although of course we remain cautious around the risk of a ‘second wave’, particularly in the context of the easing of some lockdown restrictions.
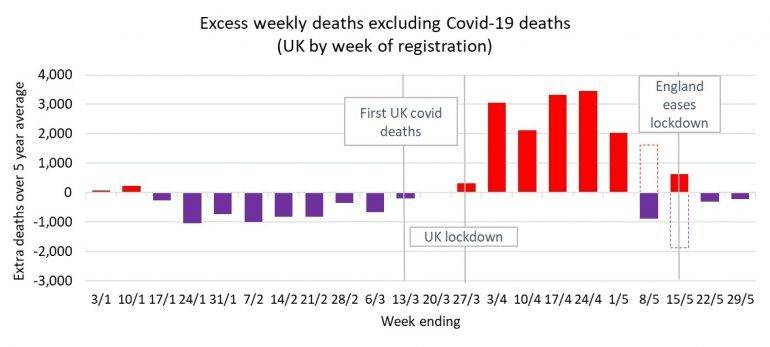
We estimate that the total death toll from COVID-19 in the UK, including both the direct and the indirect deaths (i.e. the unseasonably high excess weekly deaths shown by the red bars above), is currently around the 66,000 level.
Age profile of deaths
It has been well documented that COVID-19 deaths have primarily occurred in older people. However, this is also true of deaths generally – mortality rates typically increase rapidly with age. The chart below looks at the split by age band of registered deaths in the UK over the year to date, for those which mention COVID on the death certificate and those that do not.
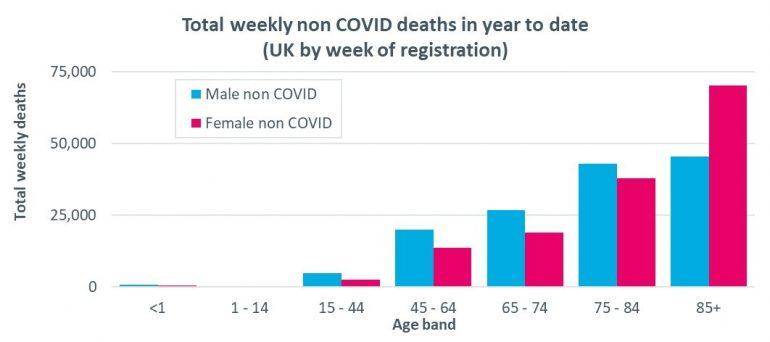
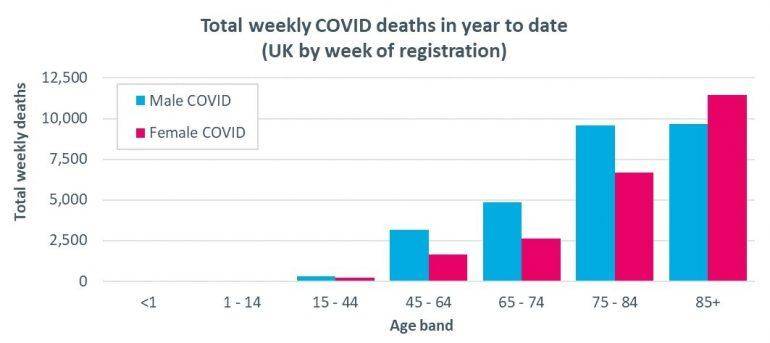
We can see that, for both men and women, COVID deaths are more heavily weighted towards the oldest ages than ‘non COVID’ deaths, while for all but the highest age band the number of deaths for men exceeds the corresponding number of deaths for women.
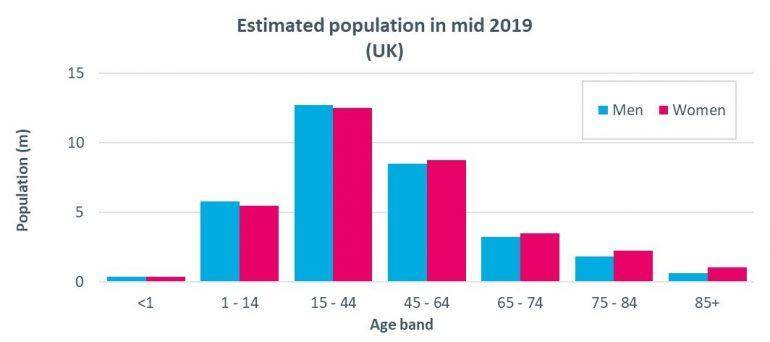
It is important to put these figures in context by considering the distribution of the population by age (and so the ‘at risk’ groups). For example, a greater proportion of women generally survive to 85+ and so it is not surprising to see a bias towards women amongst the non COVID-19 deaths in the 85+ age group.
We can use the estimated population figures published by the ONS (for mid 2019) to approximate mortality rates (estimated as the number of deaths divided by the population, for each age band). While these are only part year rates (so would need to be adjusted to allow for the remaining 30 weeks to obtain annual rates) they are nonetheless useful to show the general shape with age, as well as relative values.
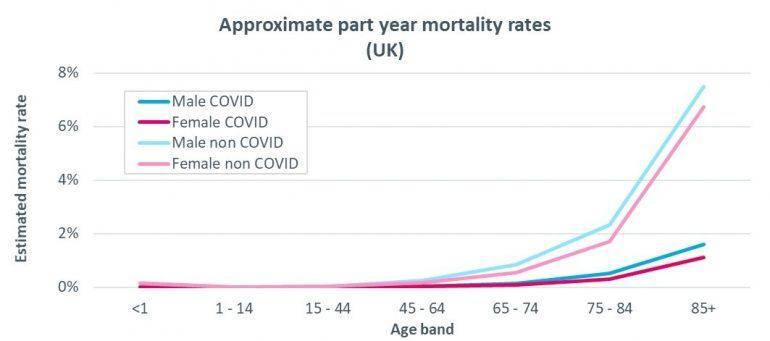
As expected, estimated (part year) mortality rates for men are higher than for women, for both the ‘COVID’ and ‘non COVID’ deaths. However, the relative values differ, with estimated mortality rates for COVID deaths almost 50% higher for men than women for those aged 85+, while non COVID deaths are only around 10% higher.
The reasons for the relatively high mortality of COVID-19 in men compared to women is not yet fully understood. There are a number of hypotheses, but it will be some time yet before we fully understand the relative risk factors.
Understanding the non COVID deaths
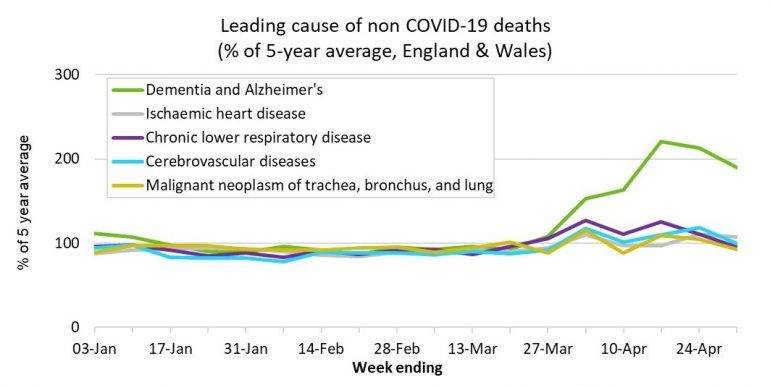
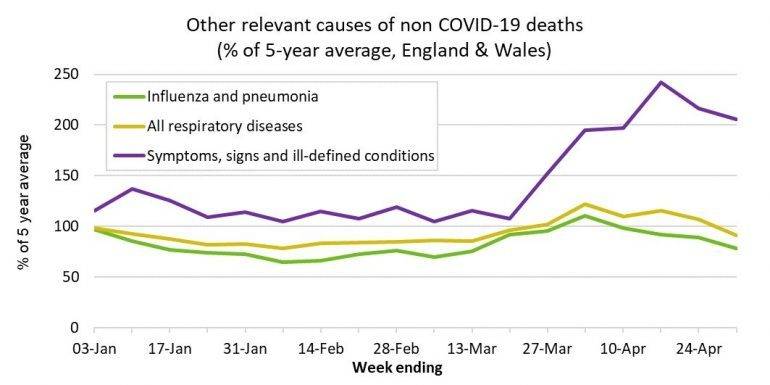
The ONS have also published more detailed analysis of the cause for those deaths which do not mention COVID-19 on the death certificate (i.e. the unseasonably high excess weekly deaths shown by the red bars above), covering the period to 1 May in England & Wales.
The charts below shows how the majority of these ‘extra’ deaths were attributed to either dementia and Alzheimer’s disease or old age/frailty (which falls within the rather cryptic "symptoms, signs and ill-defined conditions" group in the second chart). These patterns for England & Wales are also similar to what we have seen in Scotland, where our previous analysis found a marked increase in deaths attributed to Dementia/Alzheimer’s.
The supporting ONS article explores these patterns further, including differences in the patterns by the location of deaths (hospital/care home/ private home). In particular, they considered a number of possible explanations for the elevated non COVID-19 deaths:
- Undiagnosed COVID-19: The ONS conclude this is likely contributory factor, especially given the challenges for Dementia/Alzheimer’s sufferers in communicating symptoms and the difficulty in diagnosing COVID-19 in the presence of multiple co-morbidities. (We are also aware of reports of atypical symptoms being expressed amongst care home residents.)
- Delayed care: The ONS believes there is some evidence for a general reluctance to use health care facilities, especially in the hospitalisation of care home residents, but highlight the challenges in distinguishing between this and undiagnosed COVID-19.
- Reduced hospital capacity: There seems to be some indicators (for example increased deaths at home) that the very ill may be remaining at home where they would have previously been admitted to hospitals / hospices for end of life care. Although more data would be required to support this explanation.
- Stress-related causes: A “too early to tell” verdict from the ONS as (i) delays in registering deaths where an inquest is required (e.g. suicides/drugs/violence) means that it is too early to identify some of the potential manifestations of stress-related deaths; and (ii) the rise in heart attack and hypertension deaths which can be stress induced seems broadly in line with general rises and so could be attributable to one of the other explanations.
- Death registration changes: Legislative changes were implemented in response to COVID-19 to avoid a “backlog” of deaths to register. The ONS conclude that these changes have not (yet) had a material impact on death registration patterns, and so are not thought to be a material factor in the elevated non COVID-19 deaths seen to date. (We note though, that one of these changes means individuals who had seen a medical professional within the last 28 days, but not the last 2 weeks of death, are no longer referred to coroners, which may have increased the risk of undiagnosed COVID-19 cases.)
Given these possible explanations, it is perhaps unsurprising that older people are more susceptible, not just to COVID-19 itself but also other factors. It also starts to shed some much-needed light on the impact of the pandemic on healthcare provision, in both hospital and care home settings.
“All of the team at Club Vita wish to extend our condolences to anyone who has personally been touched by bereavement in recent weeks. We know that these deaths leave behind people who are missing loved ones. Our thoughts are with you…”