


In this week’s blog we explore the latest data on weekly deaths, which, for the first time since mid March, have dipped below normal levels for the latest reported week. While this is welcome news, concerns remain over the possibility of a resurgence of the current wave / a ‘second wave’, as lockdown restrictions continue to be eased across the UK.

Recent events in Leicester highlight that the virus has far from disappeared. Effective monitoring of the daily numbers of new positive cases will be extremely important in the weeks ahead, especially at local levels to avoid the need to re-enter national lockdowns.
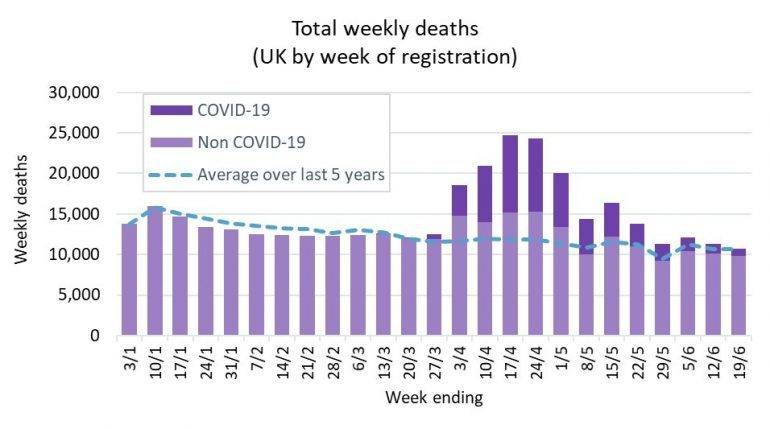
Weekly deaths below seasonal levels for the first time since mid March
The latest statistics from the ONS include detailed breakdowns of deaths registered in England & Wales up to 19th June. In particular, they identify deaths where there is any mention of COVID-19 on the death certificate. Combining this information with similar data from the corresponding statistical bodies in Scotland and Northern Ireland, we can examine emerging patterns in the data.
The latest data shows that the total registered deaths in the last reported week was just below the average for the time of year, even allowing for deaths mentioning COVID-19. Although the difference is small, nonetheless dipping below the average for the first time since mid March is welcome news, continuing the trend seen over the past few weeks of deaths returning close to seasonal norms.
Notes: A distinction is made by epidemiologists between a continuation of the current wave vs a second wave which would usually follow a period of absence of the virus and a secondary period of infections and deaths, possibly from a different strain.
Weekly figures for Scotland use a different definition of weeks, running from Monday to Sunday rather than Saturday to Friday. The chart above is based on using the Scottish data for the week ending on the Sunday immediately after the date shown on the horizontal axis. This convention is adopted in all subsequent charts in this blog.
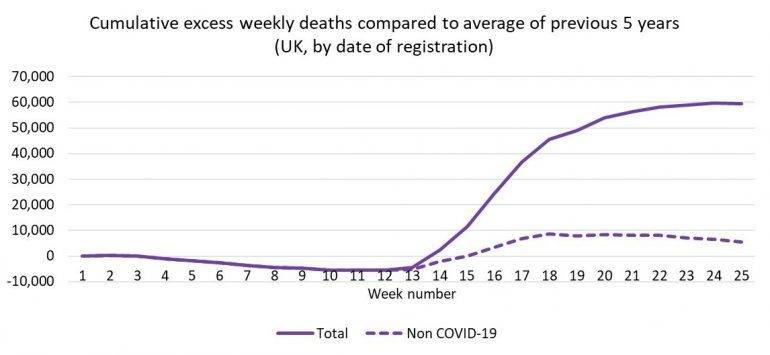
Over 14,00 missed deaths directly related to COVID-19?
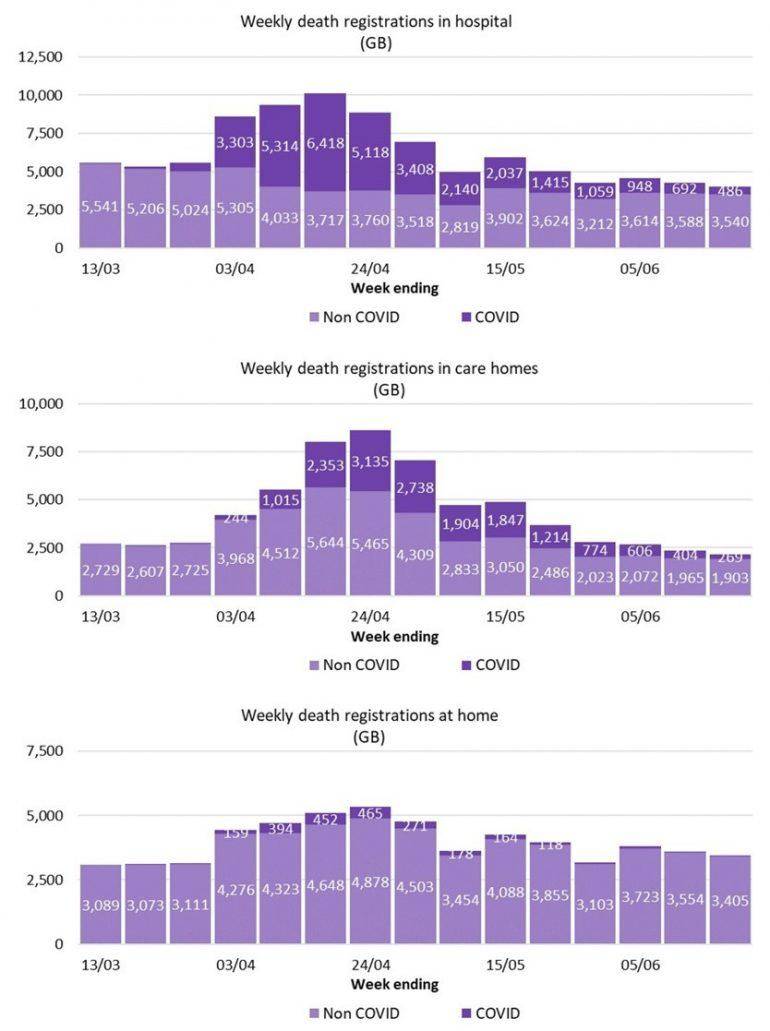
The light mauve bar in the chart above is deaths which did not mention COVID-19 on the death certificate. These deaths have remained below the seasonal average for the fifth consecutive week. It seems increasingly likely that the “wave” of over 14,000 ‘non COVID-19’ deaths seen in late March and April - the red bars in the chart below - were very directly related to COVID-19, and probably contained a high level of unidentified COVID-19 cases (see our previous blog exploring the ONS analysis of these deaths).
The COVID-19 pandemic has sadly hit care homes hard; for example over 40% of all care homes in England having experienced an outbreak. Looking at the pattern of the mauve bars in the charts below for the three dominant locations for deaths (hospital, care homes and the private home), it seems likely that many of the 14,000 excess deaths seen in late March / April and not specifically identified as COVID-19 were amongst care home residents. (Note these charts focus on Great Britain only, as statistics for non COVID deaths are not included in the weekly publications for Northern Ireland).
Whilst it is reassuring that non COVID-19 deaths have returned to, and remain close to, seasonal average levels, we remain cautious around the risk of another rise in deaths. The introduction of the first local lockdown in Leicester this week, with concerns that other areas may follow, highlights that there is very much still a risk of a return to strong growth in cases, and sadly deaths. It is therefore important to keep a close eye on daily new case figures, which will give early warning of changes in the prevalence of COVID-19 and in turn imminent rises in COVID-19 deaths.
Comparing COVID-19 experience across the home nations
The UK has seen different approaches across each of the home nations in terms of their COVID-19 response. While lockdown was applied across the UK simultaneously, subsequent decisions around the pace and approach to unwinding the restrictions have varied. The charts below look at the how COVID-19 deaths, expressed as a percentage of the total weekly deaths, have varied across the constituent countries.
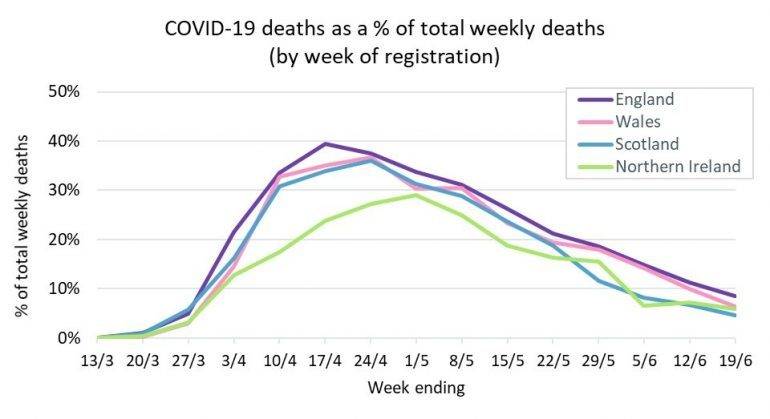
We can see how there has been some variation between the countries:
- England reached the highest peak in the shortest time.
- Wales reached a peak one week later than England, but have subsequently seen similar COVID-19 death proportions.
- Scotland peaked a week later than England, but has seen a more rapid fall, perhaps in part due to the slower pace of releasing lockdown restrictions.
- Meanwhile Northern Ireland saw the lowest (and latest) peak.
Differences between the countries will depend on a number of factors, such as age profiles, levels of urbanisation, approach to care homes, etc, as well as the variations in lockdown restrictions. It is clear that the experience of COVID-19 has varied as a result. As the countries continue to diverge in strategy in the weeks ahead, these different results may potentially become more marked.
What is the position for the year to date?
We estimate that the total death toll from COVID-19 in the UK, including both the direct and the indirect deaths (i.e. the unseasonably high excess weekly deaths shown by the red bars above), is currently around the 69,000 level.
After a relatively light start to the year, the cumulative deaths in the UK over the first 25 weeks of the year appears to have stabilised for the moment at around 60,000 higher than the corresponding weekly average values over the past 5 years.
“All of the team at Club Vita wish to extend our condolences to anyone who has personally been touched by bereavement in recent weeks. We know that these deaths leave behind people who are missing loved ones. Our thoughts are with you…”