


In this week’s blog we explore the latest data on weekly deaths, which have remained below normal levels for the latest reported week.

Whilst this is welcome news, concerns remain over the possibility of a resurgence of the current wave / a ‘second wave’, as lockdown restrictions continue to be eased across the UK and people start to take advantage of the removal of travel restrictions and venture further afield (and even abroad). Recent concerns around the possibility of spikes in case numbers in various countries, as illustrated by the abrupt re-imposition of quarantine requirements for travel to Spain over the weekend, and local tightening of restrictions in Oldham and Rochdale (amongst others) highlight the fragility of the current position.
We also continue to see an apparent divergence in the trends across the different nations in the UK, with Scotland continuing to have more success in reducing COVID-19 deaths. Effective monitoring of the daily numbers of new positive cases, along with “track and trace”, will be extremely important in the weeks ahead, especially at local levels, to ensure spikes remain localised.
Weekly deaths remain below seasonal levels
The latest statistics from the ONS include detailed breakdowns of deaths registered in England & Wales up to 17th July. In particular, they identify deaths where there is any mention of COVID-19 on the death certificate. Combining this information with similar data from the corresponding statistical bodies in Scotland and Northern Ireland, we can examine emerging patterns in the data.
The latest data shows that for the fifth week running, the total registered deaths in the last reported week was below the average for the time of year. The number of COVID-19 deaths also continues to decline. The continuation of both these trends is welcome news.
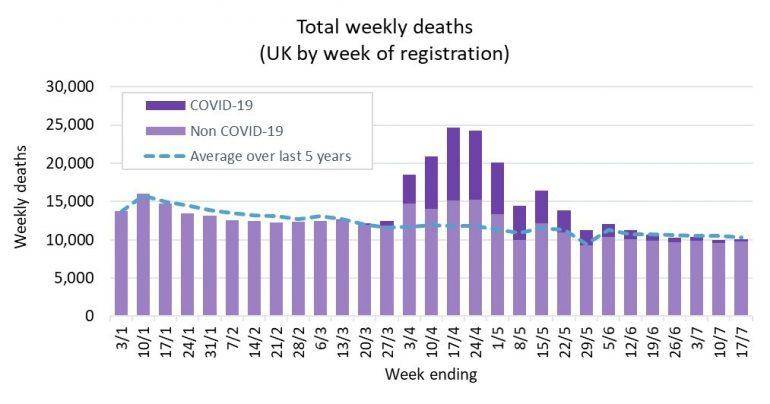
Weekly figures for Scotland use a different definition of weeks, running from Monday to Sunday rather than Saturday to Friday. The chart above is based on using the Scottish data for the week ending on the Sunday immediately after the date shown on the horizontal axis. This convention is adopted in all subsequent charts in this blog.
Comparing COVID-19 experience across the home nations
The UK has seen different approaches across each of the home nations in terms of their COVID-19 response. While lockdown was applied across the UK simultaneously, subsequent decisions around the pace and approach to unwinding the restrictions have varied. The charts below look at the how COVID-19 deaths, expressed as a percentage of the total weekly deaths, have varied across the constituent countries.
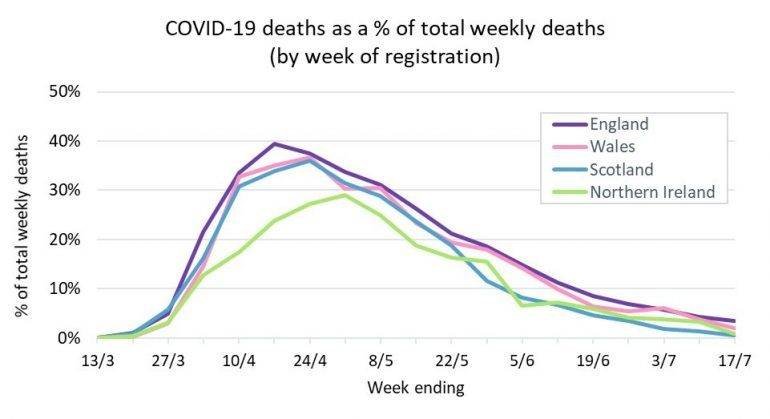
England saw the earliest and highest peak, and has generally seen the largest proportion of weekly deaths attributed to COVID-19 across the four nations. The last few weeks have seen an apparent slowdown in the rate of decline, with the proportion of deaths levelling off.
In contrast, Scotland continues to see a pronounced decline. In the most recent week, less than 1% of deaths were COVID related, compared to a peak of 36%.
Differences between the countries will depend on various factors, such as average ages and levels of urbanisation, as well as variations in the rates of unwinding lockdown restrictions. However, on the face of it, Scotland’s slower easing of restrictions appears to be paying continued dividends in attempting to eradicate the virus.
The location of COVID-19 deaths
In previous blogs we have explored the differing patterns in the location of COVID-19 deaths amongst constituent countries of the UK – and in particular the difference in experience within care homes. With the recent reductions in daily COVID deaths these patterns have received less focus, as the emphasis has shifted to reuniting families.
The charts below contrast the differing patterns over the last four months in the location of COVID-19 deaths in England, Scotland and Wales. Each chart shows, for hospitals and care homes separately, the proportion of total deaths registered each week where COVID-19 was mentioned on the death certificate.
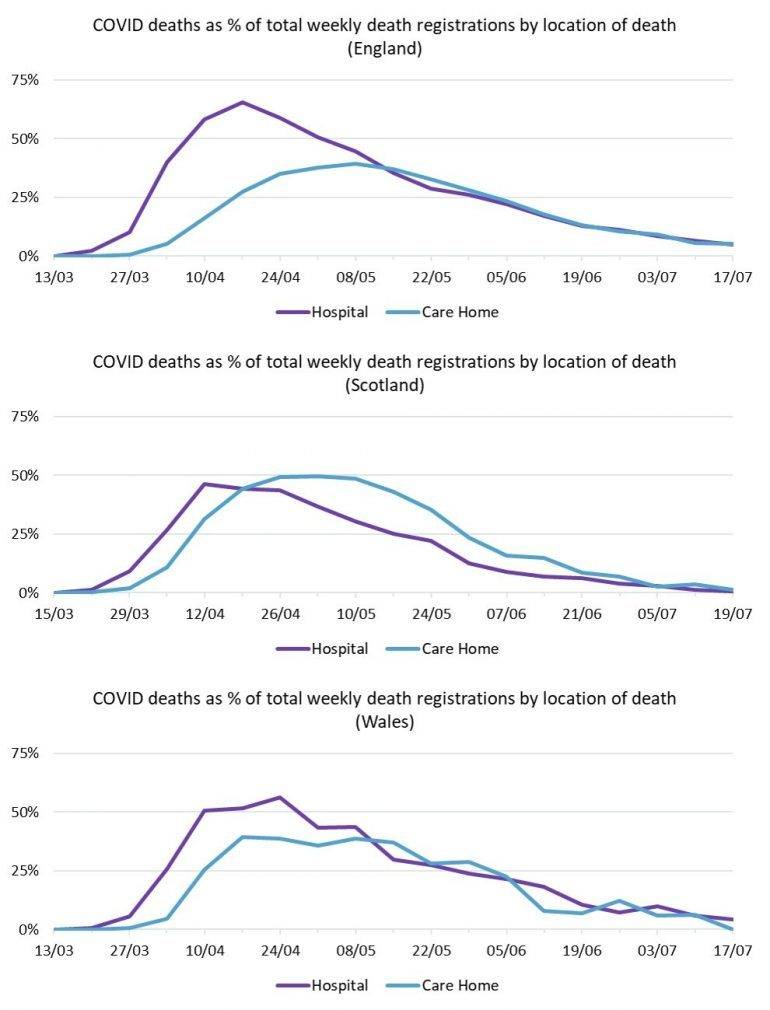
Note: Detailed data is not published to enable these charts to be produced for Northern Ireland.
England saw an initial dramatic rise in the COVID-19 deaths in the hospital setting in the early weeks of the pandemic, peaking in mid-April and declining since. However, there was a slower rise in the proportion of deaths within care homes which mentioned COVID-19 on the death certificate, peaking much later (mid-May).
In contrast, both hospital and care home deaths mentioning COVID-19 rose rapidly in Scotland. Both peaked at around half of all weekly deaths mentioning COVID-19, with care home deaths reaching the peak 2 weeks after hospital deaths.
Wales saw a similar rapid increase in hospital-based deaths as Scotland, with care home deaths also peaking 2 weeks later, although at a lower level.
These starkly different patterns suggest differing nations may have implemented differing approaches to the hospitalisation of care home residents exhibiting COVID-19 symptoms; and the readmittance of care home residents to the care home following hospitalisation and potential exposure to COVID-19. Certainly the timelines of revisions to the guidance for discharging to care homes from hospital differed between England and Scotland.
What is the position for the year to date?
We estimate that the total death toll from COVID-19 in the UK, including both directly and indirectly related deaths, is currently approaching 71,000.
After a relatively light start to the year, and a subsequent jump as a result of the pandemic, the cumulative deaths in the UK over the first 29 weeks of the year appears to have stabilised for the moment at around 60,000 higher than the corresponding weekly average values over the past 5 years. Excluding those deaths which specifically mention COVID on the death certificate, we would be looking at an ‘average’ year, with cumulative deaths just slightly above average.
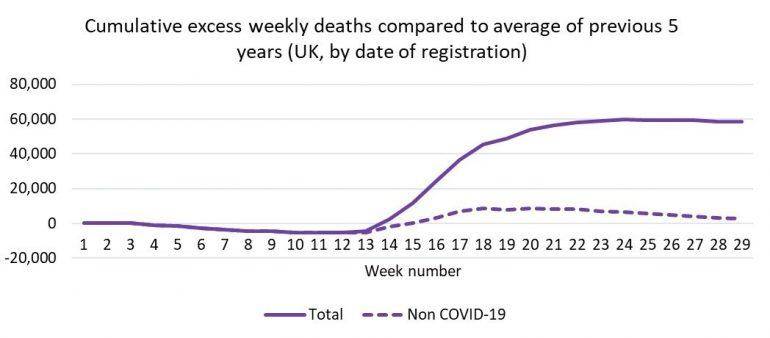
It is reassuring that the level of excess deaths has levelled off, but this chart does serve as a reminder of the sudden and dramatic emergence of COVID-19 and its impact on UK mortality. Over the course of the year we have seen excess deaths of the order of 10% of the typical annual total for the UK. Whether we remain at broadly the 60,000 excess deaths level, drop down a little due to continued lower than average non COVID-19 deaths as seen over the last few weeks, or enter a fresh phase of rising excess deaths continues to be hanging in the balance…
“All of the team at Club Vita wish to extend our condolences to anyone who has personally been touched by bereavement in recent months. We know that these deaths leave behind people who are missing loved ones. Our thoughts are with you…”
1A distinction is made by epidemiologists between a continuation of the current wave vs a second wave which would usually follow a period of absence of the virus and a secondary period of infections and deaths, possibly from a different strain.